J Med Discov (2019); 4(2):jmd19018; DOI:10.24262/jmd.4.2.19018;
Received May, 27th, 2019, Revised June 13th, 2019, Accepted June 17th, 2019, Published June 20th, 2019
Quantitation of neurotransmitter GABA analogue drugs pregabalin and gabapentin in oral fluid and urine samples by liquid chromatography Tandem Mass Spectrometry
Jianmei Wang 1,2, Beibei Xu 3
1Previous affiliation: Spectrum Diagnostic Laboratories, Arlington, TX, U.S.A 76010
2Current affiliation: Department of Pharmaceutical Science, University of North Texas Health Science Center, Fort Worth, Texas, U.S.A 76107
3Lonza Biologics Inc. Houston, TX, U.S.A 77047
* Correspondence: Jianmei Wang, Department of Pharmaceutical Science, University of North Texas Health Science Center, TX, U.S.A. Email: Jianmeijianmei@gmail.com; Jianmei.wang@unthsc.edu
Abstract
A liquid chromatography tandem mass spectrometry (LC-MS/MS) method has been established for the rapid and highly sensitive determination of GABA analogues pregabalin and gabapentin in oral fluid and urine samples. The oral fluid and urine samples were analyzed using Restrek ultra Biphenyl column, which was able to retain the polar pregabalin and gabapentin. The mobile phase consisted of a binary gradient elution profile comprising 0.1% formic acid in water and 0.1% formic acid in acetonitrile. Pregabalin and gabapentin as well as the respective internal standards Pregabalin-D6, Gabapentin-D10 were detected by a triple quadrupole mass spectrometer in the positive electrospray ionization mode within a running time of 6.8 min. The linearity ranged from 4-400 ng/mL for pregabalin, and 50-500 ng/mL for gabapentin in oral fluid; 100-10000ng/mL for them in urine samples. All compounds with coefficients, R2, ≥ 0.994. The intra-day and inter-day precisions and accuracies were within 15%. The LC-MS/MS method was validated for the purpose of quantitation of neurotransmitter GABA analogues pregabalin, gabapentin in oral fluid and urine samples and thus provided the strategy for monitoring these compounds in very high dose and high excreted concentration.
Keywords:Pregabalin, Gabapentin, saliva, urine, medical toxicology, LC-MS/MS
Introduction
Gabapentin (Neurontin®, Pfizer) and pregabalin (Lyrica®) are amino acid derivatives of gamma amino butyric acid (GABA), similar in structure and the mechanism of action. Gabapentin and pregabalin are anticonvulsant drugs and non-opiate medications for adjunctive therapy in the treatment of seizures and for peripheral neuropathic pain and appear promising in control of pain associated with mucositis and thus may reduce potential side effects associated with opiate pain medications [1].
Both urine and oral fluids were common specimen matrix in drug confirmation of pregabalin and gabapentin for clinics. Urine has long been a well-established, low cost and widely adopted test specimen in workplace, pain management and drug-testing programs [2]. Oral fluid, as the test specimen, on the other hand, has many advantages and limitations over the other biological matrices used in drug testing. Oral fluid is easily collected, far less invasive, and reflects the drug’s equivalent concentration in blood, patient’s compliance status. [3,4]. However, drugs presented in oral fluid are usually at lower concentrations than that found in urine.
Gabapentin and pregabalin are not protein-bound and not metabolized. They do not induce hepatic enzymes or inhibit metabolism of other antiepileptic drugs [5, 6]. The large doses of gabapentin coupled with urinary excretion of unchanged drug as the primary elimination route, was reported to account for the high levels of in urine up to approximately 35 g/L [7]. The drug is prescribed to populations at risk of suicide and the probability of intentional poisoning cannot be ruled out. Several confirmation assay methods such as Gas chromatography-mass spectrometry (GC-MS) have been reported for determination of pregabalin and gabapentin. However, for GC-MS, the derivatization for non-volatile compounds makes the sample preparation complicated and time-consuming [8, 9, 10]. In recent years, liquid chromatography coupled with tandem mass spectrometry (LC-MS/MS) using multiple reaction monitoring (MRM) mode were widely used and became a more practical method for confirmation and quantification of anticonvulsant drugs. It avoids the derivatization step, provides in-depth information regarding to structural analyses and offers a more sensitive and selective detection technique in comparison to UV, and fluorescence detection, GCs; We found several papers reported quantitation of pregabalin and gabapentin by LC-MS/MS which was performed for pharmacokinetics study in whole blood and plasma [11, 12, 13], but hardly was quantitation of pregabalin and gabapentin in urine and oral fluid quantitatively analyzed based on its dose and concentration in matrix.
We reported previously a highly sensitive, and high throughput method for quantitation of 26 analytes in urine simultaneously using LC-MS/MS which included pregabalin and gabapentin as the primary method [14,15]. Here, we established an independent but sufficiently sensitive, precise, accurate and fast UPLC–MS/MS (MRM) method for the clinical samples based on the prevalence of clinical samples and medication list and mass spectrometry specificity for gabapentin and pregabalin, ultimately to show the reliability of the assay in samples from clinics.
Materials and methods
Chemicals and reagents
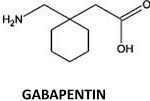
All certified reference standards including gabapentin, pregabalin and isotope labeled internal standard solutions were purchased from Cerilliant (Round Rock, Texas, USA). Methanol, DI water, acetonitrile, formic acid (LC-MS grade, 99%) were purchased from Fisher Scientific. Certified Drug-free oral fluid buffer and quantisilTM oral fluid collection device were purchased from Immunalysis (Pomona, CA). Certified Drug-free Urine was purchased from Utak (Valencia, CA). Figure 1 shows the chemical structure of GABA, pregabalin and gabapentin.
Fig. 1 The structure of GABA and GABA analogues gabapentin and pregabalin.
Instrumentation and conditions
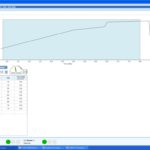
The HPLC system was equipped with two Prominence LC 20AD-XR binary pumps and a loading pump (Shimadzu, Kyoto, Japan), two DGU20A5R degassers, a CTU20AC thermostat column oven. One 2-position 6-port high pressure flow switching valve Shimadzu FCV-20AH2 (Kyoto, Japan) was used to switch between two columns controlled by MPX driver in Analyst Software (ABSciex). Two autosamplers were LEAP PAL CTC HTS-xt. The chromatography was performed using RESTEK Ultra Biphenyl Column, 100*2.1mm, 5µm (Bellefonte, PA) at oven temperature of 25oC. The gradient run started from 10% methanol in water with 0.1% formic acid to 98% methanol in water with 0.1% formic acid. The total run time was 6.8 minutes using multiplexing system with flow rate 0.6 mL/min (Figure 2, gradient run for the method.)
Mass spectrometric detection was performed on a 4500 Q-TRAP triple quadruple instrument (ABSciex) using scheduled MRM. An ESI-MS operating in positive mode was used. All data were collected using ABSciex Analyst software (version 1.6) using Analyst software and analyzed with Multiquant software.
Preparation of calibration standards and quality control samples
All primary pregabalin, gabapentin reference stock solutions with concentration 1.0 mg/mL were mixed in a 50mL volumetric flask with methanol to make the working standard solution A for gabapentin, pregabalin. Serial dilution of the working solution A with 50% methanol in water produced seven diluted solutions for standard curve preparations. Blank drug-free oral fluid and urine spiked with working standard solutions gabapentin and pregabalin at seven different concentrations was prepared to give linear range (ng/mL) from standard 1 to 7 and to make the final concentration 4-400 ng/mL for pregabalin, 5-500 ng/mL for gabapentin in oral fluid; 100-10000ng/mL pregabalin and gabapentin in drug-free urine. Stock solutions for calibration samples and quality control (QC) samples were prepared independently. Working standard solution B was prepared in the same manner as the working standard solution A, but independently, and then was diluted to four different concentrations of solution. QC samples were prepared by spiking the four different concentrations of solution into drug-free urine and oral fluid to make four concentration levels of lowest limit of quantitation, low, medium, high. The quality control bulk samples were divided into aliquots in micro centrifuge tubes (Eppendorf, 2 mL) and stored in the freezer at -20oC in same condition until analysis.
Fig. 2 Gradient run of the method.
Sample preparation
Oral fluid sample preparation: 100µL each saliva standard, and quality control was mixed with 300µL extraction buffer respectively (using ratio 1: 3) to become 400µL of each standard, and QC samples. 400µL of clinical sample from collection devices was pipetted to Eppendorf tubes. 500µL working internal standard solution was added to each tube. all tubes were capped and vortexed and centrifuged at about 21000g for 10 min. 300 µL of dilution solution (1% Formic acid in DI water) was added to all labeled vials. all supernatant was transferred to each autosampler vial, then mix thoroughly, inject 20µL of the extraction solution into LC-MS/MS.
Urine sample preparation: 10 µL urine was mixed with 300 µL working internal standard solution (pregabalin 50ng/mL, gabapentin 50ng/mL) and 1000µL of methanol were placed in a 1.8 mL eppendorf snap cap tube and mix thoroughly. The samples are vortexes at 21800 g for 10 minutes. 10µL supernatant was transferred to auto sampler vials, diluted with 1.2mL of 0.1% formic acid in 1L water. 5µL sample was injected into LC-MS/MS system.
Method validation
The method was validated including selectivity, accuracy, precision, linearity, recovery, and matrix effect and stability study. Specificity and selectivity for gabapentin and pregabalin were evaluated by analyzing blank oral saliva from at least six different healthy volunteers to ensure that no visible interferences were present at the retention time of the analyses. Curve Linearity was measured by using the ratios of the analyte peak area to the internal standard peak area versus concentration of standards by weighted linear regression (1/x2) on consecutive days. The acceptance criterion for a calibration curve was a correlation coefficient (r2) of 0.99 or better.
For all analyses, intra-day precision (CV %), accuracy (bias %) were evaluated at the lower limit of quantitation (LLOQ) and three other different concentration levels of QC samples comprised of six replicates in a batch. Precision values were expressed as the coefficient variation (CV) at each concentration, and accuracy was calculated as the percentage value of the nominal concentrations. The inter-batch accuracy and precision were performed by analyzing six replicates of four QC levels on three consecutive days. The limit of detection (LOD) was estimated as the analyte concentration whose response provided a signal to noise ratio (S/N) equal to 3, as determined from the least abundant among the qualifier ions. The limit of quantification (LOQ) was estimated based on the S/N ratio being equal or greater than 10. The acceptance criteria for inter- and intra- batch precision were 25% or better for LOQ, and 20% or better for the other concentrations, and for accuracy the acceptance criteria were 100 ± 25% or better for LOQ, and 100 ± 20% or better for the other concentration.
Stability was evaluated under different conditions that occurred during sample analysis. The long-term stability was assessed by keeping QC samples at -20oC until analysis. The freeze and thaw stability was tested by analyzing QC samples undergoing three freeze (-20oC)-thaw (room temperature) cycles. Reinjection reproducibility was to assess sample extraction reanalysis stability and to be evaluated by reanalyzing and quantifying the three concentration levels of QCs under the initial calibration curve that have been injected and retained in the auto sampler at 10oC for a period of time.
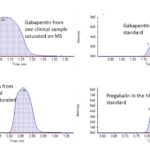
Fig. 3 Gabapentin and Pregabalin saturation on mass spectrometry from clinical sample
Recovery of all analyses was determined by comparison of the peak area of analyses in spiked oral saliva samples with the peak area of the samples prepared by spiking extracted drug-free saliva samples with the sample amounts of analyses at the step immediately prior to chromatography. Matrix effect was evaluated using blank saliva from different sources. A quantitative estimation of matrix effects was obtained by comparing the peak area of the analyses in the blank saliva from different source to that of standard solution at the sample concentration in mobile phase.
Table 1. Mass Spectrometer Parameter
| Parameter | Value |
| Polarity | ESI + |
| Curtain Gas (CUR) | 30 |
| Collision Gas(CAD) | Medium |
| IonSpray Voltage (IS) | 4500 |
| Ion Source Gas 1 (GAS1) | 60 |
| Ion Source Gas 2 (GAS2) | 50 |
| Source temperature (TEM) | 600oC |
| Q1/Q3 Resolution | Unit |
Results and discussion
We found pregabalin and gabapentin showing saturation on mass spectrometry in clinical samples cannot be neglected. About 12% of samples in each run will need sample dilution again for renalyzing pregabalin and gabapentin due to out of upper limit of quantitation window. The saturated signals of gabapentin or pregabalin could suppress the signal of amphetamine to cause absence of amphetamine peak and poor peak shape. Retention time shift that was not mitigated by use of a deuterated internal standard [16].
The chromatographic condition significantly was affected by ionic extracted solution in saliva extraction buffer which was stored in Quantisil ™oral fluid collection device as well. Using less dilution solution, didn’t increase signal sensitivity of gabapentin and pregabalin in oral fluid due to ionic suppression from extraction buffer. For feasibility of operation of instruments, we applied one instrument method to analyze both saliva and urine samples which have different extraction methods. The composition of mobile phase, column selection and efficiency were optimized previously [14]. Unlike previous method, urine samples are diluted due to saturated signals observed on mass spectrometry (Figure 3). A flow rate of 0.6 mL/min, with a run time of 6.8 min produced good symmetric peak shapes, Good resolution and separation in chromatography is critical in method development. The use of quantifiers and qualifiers to confirm drugs having very similar structures is more reliable to quantitate especially when GABA contributed interference as well. Sufficient resolution for gabapentin and pregabalin. was achieved between endogenous interference peak and patient saliva sample or urine samples.
Table 2. Retention times and selected ions of pregabalin and gabapentin and internal standards(IS)
| Compound | Precursor ion | Product Ion 1 | Product Ion 2 | Retention Time |
| (m/z) | (quantifier) (m/z) | (Qualifier) (m/z) | (min) | |
| Gabapentin | 172.1 | 137.2 | 95.1 | 1.4 |
| Gabapentin D10 | 182.2 | 164.2 | 1.3 | |
| Pregabalin | 160.1 | 55.1 | 97.1 | 0.9 |
| Pregabalin D6 | 166.1 | 148.3 | 0.9 |
The mass spectrometer used was an ABSciex 4500QTRAP fitted with an ESI (TurboIonSprayTM) source. Scheduled multiple reaction monitoring (sMRM) was used. Targeted MS data acquisition was enabled by the selection of a retention time window around the chromatographic peaks of interest. The MS settings for all MRM transitions in sample analysis were optimized by a post-column infusion of individual target compound solution and internal standard solution into electrospray source. The analyte at 10 ng/mL was infused post-column through a dead volume tee, using a syringe pump at 10 µL/min. Selectivity of the method was based on the combination of retention time, precursor and product ions, and coelution of deuterated labeled internal standard. Two MRM transitions for each compound were monitored to provide sufficient identification of drugs: the quantifier which was used for all validation parameters, and the qualifier which was used for the confirmatory analysis of the drugs of abuse. The MRM transitions of all compounds and corresponding isotopically labeled internal standards and their retention times are given in Table 1 and Table 2.
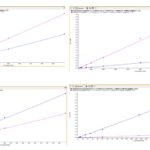
Fig.4 Linearity of pregabalin and gabapentin in urine and saliva extract.
The results of intra- and inter-day accuracy and precision are listed in Table 3. The results indicated that the method was accurate with excellent accuracy range of 2.0%-11.8%, and CV% were all within acceptance criteria of ± 20% at LOQ level and ± 15% for other concentrations. Overall, all experiment accuracy values were largely within the acceptable range of 100 ± 20% at all concentrations. The linearity and coefficiency r ≥0.99, 1/x2 was listed as below in Figure 4.
The multiple reaction monitoring chromatograms obtained from 6 urine and 6 oral fluid samples presented no peaks arising from endogenous interferences at the expected retention time for all analytes. This demonstrated that the method is highly specific for the tested analytes and free from interference from other analytes and matrix.
The recovery of all quantified analytes ranged from 82%-115%. No obvious abnormal recovery was observed. The matrix effect of urine and oral fluids samples did not appear significant. With applying isotope internal standards for most analytes, it is not surprising that no significant matrix effect was observed. The stability results of analytes over three freeze-thaw cycles indicated the analytes were stable for three freeze-thaw cycles when stored at -20oC and thawed to room temperature within the acceptance criteria of ± 20 % of the expected values of the controls, indicating the storage of urine patient samples at -20 oC is adequate, and no stability related problems for urine samples and oral samples would be expected during routine analyses.
Application to the clinic study
To ensure quality assurance in clinical sample analysis, Split data analysis and proficiency test were applied to evaluate the method by comparing the back-calculated results of drugs with the standard concentrations in proficiency test provided by The College of American Pathologists (CAP) Toxicology Program. Twice of a year split data analysis allowed us keep high quality of data accuracy when it was consistent with the expected concentrations from external reference. In order to demonstrate the applicability of the developed method to real pain patient samples, the method was used to analyze the urine and oral fluid samples collected from clinics.
Table 3. Precision and accuracy for determination of all compounds
| Analyte | Concentration | intra-day precision and accuracy (n=6) | Inter-day precision and accuracy (n=18) | ||
| (ng/mL) | CV%b | bias%a | CV% | bias% | |
| Pregabalin (urine) | LLOQ (100) | 14.34 | 3.13 | 13.06 | -1.97 |
| LQC (140) | 6.87 | 0.67 | 7.84 | -1.04 | |
| MQC (2000) | 2.56 | -2.56 | 5.23 | -1.83 | |
| HQC (8000) | 2.47 | -0.06 | 4.84 | 0.17 | |
| Gabapentin (urine) | LLOQ (100) | 3.29 | -1.6 | 7.08 | 1.71 |
| LQC (140) | 5.98 | 5 | 5.31 | 3.29 | |
| MQC (2000) | 1.81 | 3.56 | 3.03 | 5.31 | |
| HQC (8000) | 3.92 | -7 | 4.29 | -5.99 | |
| Pregabalin (saliva) | LLOQ (4) | 6.29 | 5.47 | 8.64 | 2.83 |
| LQC (5.6) | 3.45 | 2.56 | 3.39 | 6.19 | |
| MQC (80) | 4.4 | -1.11 | 4.8 | 0.15 | |
| HQC (320) | 5.62 | -5.78 | 5.55 | -1.3 | |
| Gabapentin (saliva) | LLOQ (5) | 11.33 | -3.6 | 15.07 | -6.89 |
| LQC (7) | 11.7 | 2.11 | 7.89 | 0.69 | |
| MQC (100) | 2.85 | 4.44 | 2.6 | 3.85 | |
| HQC (400) | 5.15 | 2.28 | 4.01 | 2.85 | |
a. Accuracy was defined as the difference of observed concentration from the nominal concentration (% bias) b. Precision was defined as the percentage of coefficient of variation (%CV) |
|||||
Conclusion
A liquid chromatography electrospray tandem mass spectrometry method for quantitative analyzing pregabalin and gabapentin in human urine and oral fluid has been developed. This method provided a simple sample preparation but friendly to mass spectrometry. A validated high-throughput LC-MS/MS system for quantification of gabapentin and pregabalin in human urine and oral fluid afforded us a successful application in therapeutic drug monitoring and other clinical pharmacokinetic studies in various clinical situations.
Conflict of interest
There are no competing interests to declare.
Acknowledgments
The author would like to express my thanks to my previous colleagues from Spectrum diagnostic laboratories for support and assistance. The work was not associated with any grant support.
References
1. Neurontin Medication Guide. https://www. Pfizermedical information.com/en-us/neurontin/ med guide. (Accessed November 2016).
2. Orlando G.F. Jr. Urinary Drug Testing in Pain Management. Practical Pain management. 2018 Vol 7 issue 3.
3. Scott E.; Hadland, Sharon L., Child Adolesc Psychiatr Clin N Am. 2016 Jul; 25(3): 549-565.
4. Drummer O.H., Drug Testing in Oral Fluid. Clin Biochem Rev. 2006 Aug; 27(3): 147-159.
5. McLean M.J., Clinical pharmacokinetics of gabapentin Neurology. 1994 Jun; 44 (6 Suppl 5): S17-22.
6. Zareba G., Pregabalin: a new agent for the treatment of neuropathic pain. Drugs Today. 2005 Aug; 41(8):509-16.
7. Heltsley RD., Priest A, Black DL, Robert T, Caplan YH, Cone EJ., Urine drug testing of chronic pain patients IV. Prevalence of gabapentin and pregabalin. J Anal Toxicol 2011; 35:357-9.
8. Tomáš H., Miroslava B., Pavel C., Radomír., Gabapentin, Pregabalin and Vigabatrin Quantification in Human Serum by GC-MS After Hexyl Chloroformate Derivatization. Journal of Analytical Toxicology, Volume 40, Issue 9, 16 November 2016, Pages 749-753.
9. Thejaswini J. C., Gurupadayya B. M. and Raja. P., Gas Chromatographic Determination of Pregabalin in Human Plasma using Ethyl Chloroformate Derivatizing Reagent. Journal of Pharmacy Research 5(6):3112-3115, May 2012
10. Nagaraju P., Kodali B., Datla P.V., Kovvasu, S.P., LC-MS/MS Quantification of Tramadol and Gabapentin Utilizing Solid Phase Extraction. International Journal of Analytical Chemistry Volume Article ID 1605950, 9 pages, 2018.
11. Gaurang R. S., Chinmoy G., Bharat T. T., Determination of pregabalin in human plasma by electrospray ionisation tandem mass spectroscopy. J Adv Pharm Technol Res. 2010 Jul-Sep; 1(3): 354-357.
12. Nahar P., Smith A., Patel R., Andrews R., Paterson S., Validated Method for the Screening and Quantification of Baclofen, Gabapentin and Pregabalin in Human Post-Mortem Whole Blood Using Protein Precipitation and Liquid Chromatography-Tandem Mass Spectrometry. Journal of Analytical Toxicology, Volume 41, Issue 5, June 2017, Pages 441-450,
13. Aji A., Karthikeyan S., Singh S., Puthli S.P. A Novel UPLC-MS/MS Method for Determination of γ-Amino Butyric acid Analogue in Human Plasma: Application to Pharmacokinetic Study. Journal of Applied Pharmaceutical Science Vol. 3 (06), pp. 172-178, June, 2013
14. Wang J., Yang Z., Lechago J. Rapid and simultaneous determination of multiple classes of abused drugs and metabolites in human urine by a robust LC-MS/MS method-application to urine drug testing in pain clinics. Biomedical Chromatography, Biomedical Chromatography 2013, 27 (11), 1463-1480.
15. Yang Z, Wang J, Ellis T., Interpretation of urine drug test for pain clinic: Methodology and metabolism pathways of controlled substance. The American Journal of Integrative Medicine. 2012; 2: 21-35
16. Shugarts S.B., Pervasive Gabapentin Interference in the LC-MS/MS Analysis of Amphetamine. American association of clinical chemistry 2017.024 (117).
Copyright
© This work is licensed under a Creative Commons Attribution 4.0 International License. The images or other third party material in this article are included in the article’s Creative Commons license, unless indicated otherwise in the credit line; if the material is not included under the Creative Commons license, users will need to obtain permission from the license holder to reproduce the material. To view a copy of this license, visit http://creativecommons.org/licenses/by/4.0/


