J Med Discov (2017); 2(3):jmd17036; DOI:10.24262/jmd.2.3.17036;
Received August 8th, 2017, Revised September 8th, 2017, Accepted September 12th, 2017, Published September 15th, 2017.
HepG2 cell cycle related gene transcriptional profiles are altered by a novel vanillin derivative BVAN08
Bo Zhang1,2, Lantao Liu3, Hua Guan2,Hui Wang1,Zhen Zhang1, Pingkun Zhou2*
1College of Food Science and Engineering, Jinzhou Medical University, Jinzhou121000, China
2Department of Radiation Toxicology and Oncology, Beijing Institute of Radiation Medicine, Beijing 100850, China
3Beijing Institute for Occupational Disease Prevention and Treatment, Beijing 100093, China
* Correspondence: Ping-Kun Zhou, Department of Radiation Toxicology and Oncology, Beijing Institute of Radiation Medicine, 27 Taiping Road, Beijing 100850, China. Tel: +86 1066931217; Fax: +86 1068183899. Email: zhoupk@nic.bmi.ac.cn, zhoupkek@yahoo.com.cn.
Abstract
Aim: To study the molecular mechanisms of survival and cell cycle progression of HepG2 cells treated with a novel vanillin derivative 6-bromoisovanillin (6-bromine-5-hydroxy-4-methoxybenzaldehyde, BVAN08).
Methods: MTT assay and colony-forming ability assay were used to detect cell proliferation. Apoptosis was detected by AnnexinV/PI staining. mRNA expression profiles alteration of HepG2 cells treated with BVAN08 was investigated by cDNA microarray analysis. Cell cycle related protein levels were detected by Western blotting.
Results: BVAN08 suppressed the proliferation of HepG2 cells in a dose-dependent manner. BVAN08 caused a G2/M phase arrest and the accumulation of G2/M population increased depending on the treatment time. Treatment with BVAN08 significantly decreased the cell survival and induced apoptosis. A set of genes related to cell cycle were found to be changed after BVAN08 treatment, including 4 up-regulated genes such as CDKN1A, CCNE1, CDKN1C, CDKN2D and 1 down-regulated gene CDC2. The expression of p53, p27, p21 protein level was increased by BVAN08. In the Meantime, Cyclin E protein expression level was decreased.
Conclusion: BVAN08 could inhibit HepG2 cells proliferation and induce obviously G2/M phase arrest. The alterations of cell-cycle related gene including CDKN1A, CCNE1, CDKN1C, CDKN2D and CDC2 contributing to the G2/M arrest induced by BVAN08.
Keywords: Vanillin derivative; BVAN08; cell cycle; Apoptosis; DNA damage; DNA-PKcs; Antiproliferation.
Introduction
DNA damage and cell-cycle checkpoints are critical to protect genome integrity and to suppress tumorigenesis [1]. Cells treated with DNA damaging agents, such as radiation, ultraviolet (UV) radiation, adriamycin and cisplatin, coordinately arrest their cell cycle progression at the G1–S phase, the S phase or the G2–M phase to allow times for repairing the damage. Cellular machineries that mediate cell cycle arrest are called cell cycle checkpoints, which monitor DNA status and ensure the completion of the previous phase in the cell cycle before advancing to the next phase [2, 3]. DNA replication is a particularly vulnerable phase to DNA damage of the cell division cycle. The major S phase-associated checkpoints are the DNA replication checkpoint, the intra-S-phase checkpoint, and the S–M checkpoint [4, 5]. The DNA replication checkpoints are activated in response to stalled or perturbed replication forks. In addition to the G1/S cell cycle checkpoint and the S phase cell cycle checkpoint, DNA damage agent such as IR radiation also activates the G2/M cell cycle checkpoint, which rapidly delays movement of G2 cells into the mitosis (M) phase. Loss of this checkpoint allows cells with damaged DNA to proceed into the M phase, increasing the likelihood of abnormal chromosomes being passed to the daughter cells.
The catalytic subunit of the DNA-dependent protein kinase (DNA-PKcs) has a critical role in DNA damage repair via nonhomologous end-joining, the major pathway for repair of double-strand breaks in mammals [6]. A research also indicated a role for DNA-PKcs in activating DNA damage–induced G2 checkpoint signaling [7]. Studies correlating DNA-PKcs activity and drug sensitivity suggest that DNA-PKcs may contribute to radioresistance and chemoresistance of tumor cells. Accordingly, DNA-PKcs inhibition is being studied as a means to modulate resistance to standard cancer treatments [8].
Vanillin (4-hydroxy-3-methoxybenzaldehyde), a natural component of plant extraction, has been reported to show antioxidant and anti-mutagenic activities, and to inhibit DNA-PKcs activity [9]. As a vanillin derivative, BVAN08 displayed much more potent roles on antiproliferation by inhibiting DNA-PKcs kinase and inactivating Akt in human Jurkat leukemia cells [10]. Cleavage and inactivation of DNA-PKcs induced by BVAN08 occurred concurrently with a rapid destruction of c-Myc oncoprotein [11].
In this study, BVAN08 inhibited the proliferation of HepG2 cell, induced significant G2/M phase arrest. The alteration of cell cycle related genes, including CDKN1A, CCNE1, CDKN1C, CDKN2D and CDC2, contribute to the G2/M arrest induced by BVAN08. Herein, this study provided more theory support to develop BVAN08 as a novel anticancer drug.
Materials and methods
Chemicals and Cell culture
BVAN08 was provided by Dr Lin Wang (Beijing Institute of Radiation Medicine). Chemical structures were shown previously [10]. Human cancer HepG2 cells were cultured in DMEM medium supplemented with 10% fetal bovine serum in a humidified chamber at 37 °C in 5% CO2.
Antibodies
All antibodies were purchased commercially: anti-p21 antibody, Santa Cruz (sc 6246), Cyclin E Ab-1, rabbit Pab(NeoMarkers Fremont, RB-012-PO), anti-β-actin (I-19-R, SantaCruz,CA), anti-Rabbit IgG(H+L)/HRP (ZB-2301,Zhongshan, Beijing, China), anti-Mouse IgG(H+L)/HRP (ZB-2305, Zhongshan, Beijing, China).
MTT Assay
Cells (104 cells/well) were seeded into 96-well plate with 200 μl medium and cultured at 37 °C for 24 h later, the medium was replaced with fresh media containing indicated drug. After 24 h incubation with the drug, 20 μl of MTT (5 mg/ml) was added to each well and incubated for 4 h. The medium was discarded and 150 μl of DMSO was added to each well and incubated for another 20min. The OD value at 570 nm was measured and the cell growth inhibitory ratio was calculated via following formula and described with cell growth inhibitory curve. Cell Growth inhibitory ratio= [1 – (average absorbance of experimental group/average absorbance of control group)] ×100%. The experiments were repeated at least three times. The half-maximal (50%) inhibitory concentration (IC50) was calculated with the curve.
Clonogenic survival
The cells were trypsinized, counted, and diluted to certain concentrations. An appropriate number of cells (1×10⁴) were plated into 60 mm diameter petri dishes in triplicate, and incubated in the culture medium containing 60 μΜ BVAN08 for 12 h and 24 h, then continuously incubated in the growth medium without BVAN08. After total of 2 weeks culture, cells were fixed with methanol, stained with Giemsa solution, and colonies consisting of more than 50 cells were counted.
Apoptosis detection
The BVAN08-induced apoptosis of HepG2 cells was firstly evaluated by means of fluorescent dye staining. Cells were harvested after BVAN08 treatment for certain time, and KGA-212 kit was used to detect apoptosis. For the determination of apoptosis, BVAN08-treated cells were washed in PBS and re-suspended in 500 μl binding buffer at a concentration of 1×10⁶ cells/ml. And then 5 μl of annexin-V-FITC and 5 μl PI was added. The tubes were incubated for 20 min at room temperature in the dark. Flow cytometric analysis was performed immediately after supravital staining. The amounts of early apoptosis and late apoptosis/necrosis were determined respectively, as the percentage of Annexin V+/PI− or Annexin V+/PI+.
Typan blue stain assay
0.5 ml of a suitable cell suspension (dilute cells in complete medium without serum to an approximate concentration of 1 x 10⁵ cells per ml) and 0.1 ml of 0.4% Trypan Blue were added into a screw cap test tube. The tube was mixed thoroughly and allowed to stain for 5 min at 15 to 30 °C. Nonviable and viable cells were counted with microscope and hemocytometer.
Microarray analysis
Cells were lysed in Trizol reagent (Invitrogen, CA) and total RNA was purified according to the manufacturer’s instructions. 20 μg of total RNA from HepG2 control cells and cells treated by BVAN08 at 60 μM for 24 h were used as template for generating a Cy3 or Cy5-labeled cDNA probe through an in vitro reverse transcription reaction. The labeled cDNA was purified using a QIA quick PCR purification kit (Qiagen, Hilden, Germany), and hybridized to olignucleotide microarray which contains a set of oligonucleotide probes corresponding to human cell cycle related genes (CapitalBio Corporation, Beijing, China). After hybridization and washing, each labeled cDNA probe bound to its complementary olignucleotide was scanned by LuxScan 10K/A (CapitalBio Corporation), and the intensities of fluorescent images were captured and data were processed using LuxScan3.0 imaging software for analyses of cell cycle changes.
RT-PCR analysis of gene expression
Reverse transcriptional polymerase chain reaction (RT-PCR) was used to semi-quantify the mRNA expression level of genes. Briefly, first-strand cDNA was reversely transcribed from 5 μg of the total RNA using random primer and Moloney murine leukemia virus (MMLV) reverse transcriptase (Clontech, Mountain View, CA, USA). The primer pairs and PCR conditions for each gene are listed in Table 1.The number of PCR cycles used allowed the quantification without reaching the amplifying plateau for PCR products. As internal standard, a fragment of human endogenous β–actin was amplified simultaneously in each PCR reaction. PCR products were resolved on a 2.0% agarose gel and the bands were visualized by ethidium bromide staining. Each of the genes was amplified in three parallel.
Real-time PCR analysis of gene expression
The gene level was examined in real-time PCR (ABI 7300) and data were analyzed by SDS software. PCR was performed using 20 μl of reaction volume. The primer pairs and PCR conditions for each gene are listed in Table 2. The number of PCR cycles used allowed the quantification without reaching the plateau for PCR amplification. As an internal standard, a fragment of human endogenous was amplified simultaneously in each PCR reaction. PCR products were resolved on a 1.5% agarose gel and the bands were visualized by ethidium bromide staining. β–actin was used as the control.
| Gene | Primer pairs | PCR conditions | Products size(bp) |
| β–actin | F:5’GCCAGGTCCAGACGCAGGAT3’
R:5’CGGTCCAGGTCTGTGTCCTA3’ |
94℃for15s,56℃for30s ,72℃for30s,28cycles | 127 |
| CDC2 | F:5’GATTCTATCCCTCCTGGTC3’
R:5’CTAGGCTTCCTGGTTTCC3’ |
94℃for15s,56℃for 30s,72℃for30s,30cycles | 475 |
| CDKN1C | F:5’ACGAGACAGGCGAACCC 3′
R:5’TCGTAATCCCAGCGGTTC3′ |
94℃for15s,60℃for30s,72℃for30s,28cycles | 380 |
| CCNE1 | F: 5’TTTACCCAAACTCAACG3′
R: 5’CCATCTGTCACATACGC3′ |
94℃for15s,58℃for 30s,72℃for30s,28cycles | 389 |
| CDKN2D | F:5’GGCACTTCCAATCCATCT3′
R: 5’CCCTTGGGTCTCGTCTG3’ |
94℃for15s,56℃for 30s,72℃for30s,26cycles | 472 |
| CDKN1A | F: 5’CCCGTGAGCGATGGAACT3′
R:5’CGAGGCACAAGGGTACAAGA3’ |
94℃for15s,60℃for 30s,72℃for30s,29cycles | 232 |
Table 1. Primers of human genes used in RT-PCR
| Gene | Primer pairs | PCR conditions | Products size(bp) |
| β–actin | F:5’ATCACCATTGGCAATGAGCG3′
R:5’TTGAAGGTAGTTTCGTGGAT3′ |
50℃for2mins,95℃for10min,95℃for15s,60℃for1min,40 cycles | 89 |
| CDC2 | F:5’TGATCCAGCCAAACGAATTTC3′
R:5’GCTACATCTTCTTAATCTGATTGTCCAA3′ |
50℃for2mins,95℃for10min,95℃for15s,60℃for1min, 40 cycles | 86 |
| CDKN1C | F:5’CAGAACCGCTGGGATTACGA 3′
R:5’CACCGAGTCGCTGTCCACTT 3′ |
50℃for2mins,95℃for10min,95℃for15s,60℃for1min, 40 cycles | 380 |
| CCNE1 | F: 5’TCGATTTTGGCCATTTCTTCA 3′
R:5’CGTGACCGTTTTTTTGCAGGATCC’ |
50℃for2mins,95℃for10min,95℃for15s,60℃for1min, 40 cycles | 69 |
| CDKN1A | F:5’CCTCATCCCGTGTTCTCCTTT3′
R: 5’GTACCACCCAGCGGACAAGT3′ |
50℃for2mins,95℃for10min,95℃for15s,60℃for1min, 40 cycles | 97 |
Table 2. Primers of human genes used in real-time PCR
| Gene description | GB accession No. | Fold change |
| Cyclin-dependent kinase inhibitor 1A (p21, Cip1), CDKN1A | L47233 | 2.34 |
| Cyclin E1, CCNE1 | M73812 | 1.89 |
| Cyclin-dependent kinase inhibitor 1C (p57, Kip2), CDKN1C | U22398 | 1.63 |
| Clclin-dependent kinase inhibitou 2D (p19, inhibits CDK4), CDKN2D | U40343 | 1.61 |
| Cell division cycle 2, CDC2 | NM_001786 | 0.66 |
Table 3 Selected Genes with gene expression more than 1.5-fold with BVAN08 treatment in HepG2 cells
Western blotting analysis
The cells were harvested and washed twice in ice-cold phosphate buffered saline. Cell pellets were treated with the lysis buffer (50 mM Tris–HCL, pH 7.5, 1% Noridet P40, 0.5% sodium deoxycholate, 150 mM NaCl,1 piece of Protease inhibitor cocktail tablet in 50 ml solution, Roche Co, USA). Cells were harvested and the cell lysates were prepared and subjected to immuno-hybridization analyses with corresponding antibodies.The total protein (40 μg) was resolved on SDS/PAGE, and transferred onto the polyvinylidene fluoride (PVDF) membrane for western blotting. The immuno-hybridization was performed with the first antibodies as described above, then, incubated with secondary antibody IgG-HRP. Protein expression levels were detected with the luminal analysis reagents (Santa Cruz) according to the manufacturer’s instructions.
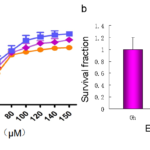
Figure1. Proliferation inhibition of BVAN08 on HepG2 cells.
a: The inhibition curve of HepG2 cells treated with different concentration of BVAN08.
b: Survival fraction of HepG2 cells treated with BVAN08.
As compared with control, # P<0.01.
The data of each bar are the mean with standard divisions from 3 independent experiments.
Results
Antiproliferative effect of BVAN08 on HepG2 cells
The cell survival was assayed by MTT method. HepG2 cells were treated with various concentrations of BVAN08 for 24 h, 48 h, 72 h individually and the IC50 against the HepG2 cells were 77.8, 67.8, 53.5 μΜ, respectively. The inhibitory role on cell proliferation by BVAN08 was also shown in a dose-dependent manner (Fig.1a). The results of cell colony-forming analyses (survival) indicated that the treatment with BVAN08 at 60 μΜ for 12 h or 24 h (Fig. 1b), for exhibiting a potent antiproliferative effect on HepG2 cells.
Apoptosis induced by BVAN08
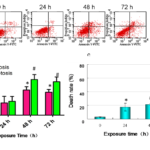
BVAN08-induced apoptosis was then measured by means of the detection by Annexin V/ PI staining. The results showed that BVAN08 induced apoptosis of HepG2 cells in a time-dependent fashion. The percentage of apoptosis was increased when treated HepG2 cells with 60 μΜ BVAN08 for 48 h. The necrosis was obviously increased after the same treatment (Fig.2a.b). The death rate induced by BVAN08 was shown in a time-dependent manner, and the ratio of dead cells was up to 55% after 72 h treatment with 60 μΜ BVAN08 (Fig.2c).
Effect of BVAN08 on the transcriptional profiling of cell-cycle related genes
To investigate the molecular mechanism of BVAN08 on cell antiproliferation, the technique of olignucleotides microarray was used to investigate the effect of BVAN08 on the transcriptional profile of cell cycle related genes. To test the reliability of transcription profile analysis, a repeat experiment was carried out for the microarray analysis. A 1.5-fold increase or decrease in signal intensity is commonly taken as a significant change in mRNA expression. In total, five genes had changed expression, including one down-regulated gene, CDC2, and four up-regulated genes CDKN1A, CCNE1, CDKN1C, and CDKN2D (Tab.3).
Figure2. BVAN08-induced apoptosis in time-dependent manner.
a: Flow cytometry analysis of fluorescence.
b: The percentage of apoptosis and necrosis after 60 μΜ BVAN08 treated for different times.
c: The death rate of HepG2 cells after 60 μΜ BVAN08 treated for different times was detected by Typan blue stain.
As compared with control * P<0.05, # P<0.01
The data of each bar are the mean with standard divisions from 3 independent experiments.
Figure3. Validation of gene modulations observed in the microarray analysis by semi-quantitative RT-PCR.
a: electrophoresis of PCR products.
b: quantification of mRNA level, each bar represents the means from three independent experiments.
Validation of altered expression of genes selected in microarray
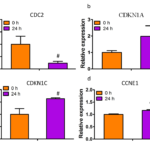
These gene expression changes detected in the microarray were validated by semi-quantitative RT-PCR (Fig.3a.b). For all five genes, the alterations of CDKN1A, CDKN1C, CDKN2D mRNA expression determined by RT-PCR matched those detected in the microarray assays, but the CCNE1 was not obviously changed. Furthermore, some genes were also validated by RT-PCR (Fig.4). The result showed that the CDC2 gene was down-regulated after 60 μΜ BVAN08 treated for 24 h (Fig.4a), and the CDKN1A, CDKN1C, CCNE1 gene levels were relatively higher than those untreated HepG2 cells (Fig.4 b.c.d).
Figure4. The mRNA levels of genes were also validated by real-time PCR in HepG2 cells with 60 μM BVAN08 treated for 24 h.
a:The mRNA levels of the CDC2 gene.
b: The mRNA levels of the CDKN1A gene.
c: The mRNA levels of the CDKN1C gene.
d: The mRNA levels of the CCNE1 gene.
The bar represents the means from three independent experiments.
As compared with control * P<0.05, # P<0.01.
The effect of BVAN08 on cell cycle related protein
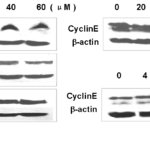
The immuno-hybridization assay showed that the amount of p21 (CDKN1A) protein was significantly increased after treatment with different concentrations of BVAN08 for 24 h. Moreover, CDKN1B and CDKN1A were two inhibitors of CDK, and the results indicated that the p27 (CDKN1B) protein level was also increased. The p53 tumor suppressor plays a central role in regulating cell cycle and apoptosis, and we found that the p53 protein was also markedly increased in the BVAN08-treated HepG2 cells for 24 h (Fig.5a). This result was consistent with the alteration of p21 protein.
During S- and G2-phase, Cyclin E/CDK2 complexes are important to regulate further progression in the cell cycle. The Cyclin E protein level was found reduced after different concentrations of BVAN08 treatment for 24 h, moreover, the amount of Cyclin E gradually decreased after 60 μΜ BVAN08 treated for 8 h (Fig.5b).
Figure 5. Detection of protein expression by immunohybridization.
a: Proteins expression in HepG2 cells after BVAN08 treated with for 24 h.
b: Expression of Cyclin E detected by Western blotting analysis after BVAN08 treated with for 24 h and 60 μM BVAN08 treated for different times.
Discussion
To insure the accurate transmission of genetic information, eukaryotic cells have developed an elaborate network of checkpoints to monitor the successful completion of every cell cycle step and to respond to cellular abnormalities such as DNA damage and replication inhibition as they arise during cell proliferation. Our observations showed that BVAN08 inhibited cell proliferation activity, which is in agreement with previous reports [11, 12]. Moreover, in this study apoptosis was characterized by Annexin-V staining. All the results indicated that BVAN08 induced apoptosis in a time-dependent manner.
Our microarray array analysis also revealed a number of cell cycle control related genes, including CDKN1A, CCNE1, CDKN1C, CDKN2D, and Cdk1, formerly called CDC2, interacted with Cyclin B1 to construct the mitosis-promoting factor, MPF complex. Accumulation and activation of the Cdk1/Cyclin B1 complex is essential for mitotic entry and progression [13], which was found to be down-regulated after 60 μM BVAN08 treated for 24 h. But the result of flow cytometry indicated an accumulation G2/M population. The HepG2 cells were not exited mitotic period but long time arrest at G2/M phase, so we could suppose that cells were turn into apoptosis.
Under a variety of stress conditions, wild-type p53 protein quickly accumulates in the nucleus and then can transcriptionally regulate a number of downstream genes that control cell cycle arrest or apoptosis [14, 15]. Many reports indicated that p53 mediates Cyclin B/CDC2 inactivation and mitotic release directly via CDKN1A induction [16]. The results of real-time PCR and western blotting analyses indicated that CDKN1A expression was increased in both mRNA and protein levels in BVAN08-treated HepG2 cells. Western blotting analysis showed the CDKN1B and p53 expression were also increased, indicated that BVAN08 induced cell cycle arrest depending on p53 pathway.
The inappropriate activation of these CDKs, including the increased expression of Cyclin E, is associated with tumor formation [17, 18]. Additionally, the CyclinE/CDK2 kinase is activated in response to several oncoproteins, including c-Myc and the adenoviral E1A protein, further supporting a role of this kinase in tumorigenesis [19]. During S- and G2-phase, Cyclin A/CDK2 complexes, in part overlapping with Cyclin E/CDK2, are important to regulate further progression in the cell cycle and many of the Cyclin E/CDK2 substrates are also phosphorylated by Cyclin A/CDK2. The microarray array and RT-PCR also revealed Cyclin E was increased in mRNA level, but the protein levels detected by western blotting analysis were depressed in both 60 μM BVAN08 treated for different times and different concentration levels of BVAN08 treated for 24 h. One possible reason for this was that as for the G1 checkpoint, BVAN08 induced a marked increase in the expression of p53 and p21 proteins, and a typical pathway of p53-mediated G1/S transition arrest in which p53-inducible p21 protein inhibits the expression of Cyclin E and cdk2 protein.
Taken together, these results indicated that BVAN08 inhibit proliferation and induce apoptosis on HepG2 cells. The alterations of cell cycle related gene contribute to the apoptosis induced by BVAN08. The observation of cell cycle related genes provides an important clue for the further investigation of the cell-cycle checkpoint post BVAN08 treatment, moreover, for elucidating the related mechanism as antitumor drug.
Conflict of interest
None
Acknowledgments
This work was supported by Chinese National Natural Science Foundation (Grants No. 81372925, 31370843, 81530085) and the Foundation of Jinzhou medical school.
References
- Kastan, M.B. and J. Bartek, Cell-cycle checkpoints and cancer. Nature, 2004. 432(7015): p. 316-23.
- Elledge, S.J., Cell cycle checkpoints: preventing an identity crisis. Science, 1996. 274(5293): p. 1664-72.
- Kops, G.J., B.A. Weaver, and D.W. Cleveland, On the road to cancer: aneuploidy and the mitotic checkpoint. Nat Rev Cancer, 2005. 5(10): p. 773-85.
- Osborn, A.J., S.J. Elledge, and L. Zou, Checking on the fork: the DNA-replication stress-response pathway. Trends Cell Biol, 2002. 12(11): p. 509-16.
- Bartek, J., C. Lukas, and J. Lukas, Checking on DNA damage in S phase. Nat Rev Mol Cell Biol, 2004. 5(10): p. 792-804.
- Meek, K., et al., The DNA-dependent protein kinase: the director at the end. Immunol Rev, 2004. 200: p. 132-41.
- Arlander, S.J., et al., DNA protein kinase-dependent G2 checkpoint revealed following knockdown of ataxia-telangiectasia mutated in human mammary epithelial cells. Cancer Res, 2008. 68(1): p. 89-97.
- Salles, B., et al., The DNA repair complex DNA-PK, a pharmacological target in cancer chemotherapy and radiotherapy. Pathol Biol (Paris), 2006. 54(4): p. 185-93.
- Ho, K., et al., Apoptosis and cell cycle arrest of human colorectal cancer cell line HT-29 induced by vanillin. Cancer Epidemiol, 2009. 33(2): p. 155-60.
- Liang, J.A., et al., Vanillin inhibits matrix metalloproteinase-9 expression through down-regulation of nuclear factor-kappaB signaling pathway in human hepatocellular carcinoma cells. Mol Pharmacol, 2009. 75(1): p. 151-7.
- Fitzgerald, D.J., et al., Structure-function analysis of the vanillin molecule and its antifungal properties. J Agric Food Chem, 2005. 53(5): p. 1769-75.
- Yan, Y.Q., et al., Vanillin derivative 6-bromine-5-hydroxy-4-methoxybenzaldehyde-elicited apoptosis and G2/M arrest of Jurkat cells proceeds concurrently with DNA-PKcs cleavage and Akt inactivation. Int J Oncol, 2006. 29(5): p. 1167-72.
- Yan, Y.Q., et al., Induction of apoptosis and autophagic cell death by the vanillin derivative 6-bromine-5-hydroxy-4-methoxybenzaldehyde is accompanied by the cleavage of DNA-PKcs and rapid destruction of c-Myc oncoprotein in HepG2 cells. Cancer Lett, 2007. 252(2): p. 280-9.
- Nurse, P., Universal control mechanism regulating onset of M-phase. Nature, 1990. 344(6266): p. 503-8.
- Zhang, B., et al., Proteomic profiling revealed the functional networks associated with mitotic catastrophe of HepG2 hepatoma cells induced by 6-bromine-5-hydroxy-4-methoxybenzaldehyde. Toxicol Appl Pharmacol, 2011. 252(3): p. 307-17.
- Vogelstein, B., D. Lane, and A.J. Levine, Surfing the p53 network. Nature, 2000. 408(6810): p. 307-10.
- Laptenko, O. and C. Prives, Transcriptional regulation by p53: one protein, many possibilities. Cell Death Differ, 2006. 13(6): p. 951-61.
- Taylor, B.F., et al., p53 suppression of arsenite-induced mitotic catastrophe is mediated by p21CIP1/WAF1. J Pharmacol Exp Ther, 2006. 318(1): p. 142-51.
- Swanton, C., Cell-cycle targeted therapies. Lancet Oncol, 2004. 5(1): p. 27-36.
Copyright
© This work is licensed under a Creative Commons Attribution 4.0 International License. The images or other third party material in this article are included in the article’s Creative Commons license, unless indicated otherwise in the credit line; if the material is not included under the Creative Commons license, users will need to obtain permission from the license holder to reproduce the material. To view a copy of this license, visit http://creativecommons.org/licenses/by/4.0/


