

J Med Discov (2023); 8(1):jmd23021; DOI:10.24262/jmd.8.1.23021;
Received June 2nd, 2023, Revised August 18th, 2023, Accepted September 22th, 2023 , Published October 10th, 2023.
Study on detection and diagnosis of angiogenesis in lung cancer under convolutional neural network of artificial intelligence region
Zhang Ping1, Dou Fangfang3, Cai Xinyong2, Liu Yuanyuan2, Chen Yanmei3, Hong Lang2, Shao Liang2*
1Department of Neurology, Jiangxi provincial People’s Hospital, the First Affiliated Hospital to Nanchang Medical College, Nanchang 330006, , Jiangxi, China.
2Department of Cardiology, Jiangxi provincial People’s Hospital, the First Affiliated Hospital to Nanchang Medical College, Nanchang 330006, Jiangxi, China
3Jiangxi provincial People’s Hospital, the First Affiliated Hospital to Nanchang Medical College, Nanchang 330006, , Jiangxi, China.
* Correspondence:Shao Liang,Department of Cardiology, Jiangxi provincial People’s Hospital, the First Affiliated Hospital to Nanchang Medical College, Nanchang 330006, Jiangxi, China .E-mail: shaoliang021224@hotmail.com
Abstract
Objective: With the continuous development of artificial intelligence in the medical field, the deep learning algorithm represented by convolutional neural network has made great achievements in medical auxiliary diagnosis technology. The detection algorithm of angiogenesis in lung cancer often faces problems such as low detection sensitivity, low classification accuracy and large number of false positives. Therefore, this paper proposed a lung cancer blood vessel detection algorithm based on deep convolutional neural network (CNN).
Methods: There were mainly four stages in this algorithm. The first step was to simplify the conventional full volume integral segmentation network according to the detection characteristics, specifically . The second step was that the improved weighted loss function was used to reduce the loss rate of image recognition, and the deep supervised learning algorithm was used to deeply supervise the CNN layer, so as to improve the sensitivity of lung cancer blood vessel detection; in the third step, we improved the image information based on two-dimensional scale to three-dimensional scale, so that the algorithm could more accurately extract the vascular features of lung cancer. Finally, the fusion classification model obtained by long-term and short-term training was applied to the classification of candidate vessels, achieving the goal of reducing the false positive rate.
Results: Through the experiments, our algorithm model shows better performance compared with other model algorithms. In the periods of detection and classification, the sensitivity of this algorithm was as high as 0.841 compared with the conventional full convolutional segmentation network. Conclusion: The detection algorithm based on 3D convolutional neural network proposed in this paper reduces the occurrence of positive results and improves the accuracy of image reading in the detection of angiogenesis in lung cancer.
Keywords:Detection of angiogenesis in lung cancer; Deep convolutional neural network; Deep supervision; Fused classification model; Multiscale
Introduction
At present, the staging diagnosis of a large number of lung diseases, such as pulmonary hypertension, vascular lesions, lung tumors, often focuses on the changes of pulmonary blood vessels. In order to detect and treat lung disease early, computer-aided diagnosis (CAD) technology is usually used in early diagnosis to quickly and accurately segment the pulmonary blood vessels and find the lesion location, so a large number of artificial intelligence algorithms have attracted extensive attention of researchers. Lung cancer in early stage is mostly asymptomatic, and almost two third of lung cancer patients are in advanced stage at the time of treatment, while angiogenesis of lung cancer plays an important role in early screening of lung cancer. Generally, tumor blood vessels provide sufficient nutrients to the tumor to promote tumor growth, and the tumor blood vessels continuously transport tumor cells to other parts of the host, resulting in malignant growth and metastasis of the tumor. There is evidence that there are no blood vessels in the early stage of lung cancer formation when the tumor growth rate is very slow and can be in a “dormant” state for a long time; after the angiogenesis of lung cancer, the tumor grows logarithmically and continues to spread and metastasize [1]. It is difficult to identify the asymptomatic manifestations of lung cancer in early stage, which usually causes patients to lose the best time for treatment. In order to reduce the occurrence of this situation, it is necessary to screen the angiogenesis of lung cancer early. As the most valuable noninvasive method at present, CT examination is also the most widely used auxiliary technology in lung cancer screening, but it usually relies on clinical experience and is easily affected by subjective judgment, and the large amount of manual smear-reading often leads to missed diagnosis and misdiagnosis. With the rapid development of deep learning, convolutional neural network (CNN) is also gradually applied to the detection of lung cancer vessels in CT images. Compared with the past computer vision algorithms, deep learning can automatically and quickly extract the complex high-level abstract features of data, and the final output features can be used for direct recognition, classification and detection of data. The process shows a high degree of automation and accuracy, which has great advantages in improving detection sensitivity and reducing the number of false positives.
At first, a large number of two-dimensional convolutional neural networks (2D CNN) have emerged in the field of lung cancer detection. Setio and other people[2] have developed a 2D CNN based on multi view, which can fully extract information in different directions on the plane and then adopts a new fusion method, successfully reducing the false-positive rate of lung disease detection. Zhao and others[3] have proposed a new mode framework and combined with single view two-dimensional neural network to reduce false positives in lung nodule detection. The training scheme of the network based on classification has successfully expanded the learning ability of representative detection targets. However, 2D CNN has limitations in detecting blood vessels in lung cancer. It usually ignores the spatial and distribution characteristics of blood vessels, so the accuracy cannot be better improved. The 3D convolutional neural network (3D CNN) is more sufficient when combining the spatial information of the image, and can completely extract the 3D features of lung cancer blood vessels. Peng and others[4] have designed a fast convolutional neural network based on the fusion of three-dimensional dual path and encoder decoder structure, which has achieved full automation for the diagnosis of lung CT cancer. The system also added gradient boosting machine (GBM) to make the classification of detection targets more accurate. In the 3D convolutional neural network designed by Lyu and others[5], the input size of the network is more refined, which greatly improves the classifiable accuracy, and verifies that the 3D convolutional neural network can effectively reduce the number of false positives by making full use of the performance advantages in 3D spatial information of the detection targets.
In order to further improve the detection accuracy, a 3D CNN pulmonary vascular detection network (MS-CSANet) based on multi-scale attention mechanism was proposed in this paper. This method added a three-dimensional multi-scale feature extraction module to the design, which could fully extract the complex features from different scales and the multiple information of blood vessels in the spatial dimension, which could more accurately identify blood vessels. Through the fusion of various attention modules, the relevant information between each feature was mined from multiple angles, such as space, channel, region, etc., to strengthen the corresponding features. The output features were fused in a Gaussian pyramid mechanism containing shallow location region information and deep semantic information, so as to achieve accurate positioning of the targets.
1.Materials and methods
1.1 The improved candidate cancer angiogenesis detection based on ResNet
Segmentation of blood vessels is one of the important steps of lung cancer detection system, which is mainly used to limit the CT images to select blood vessels sensitively and ensure the accuracy in the process of detecting blood vessels. At this stage, the blood vessels were segmented and extracted after the improvement of MS-SCANet network. Firstly, the segmented two-dimensional image of lung parenchyma was input and during the segmentation process, the deep supervised learning mode was introduced and the dice loss was also improve to continuously synthesize the results of the two layers, and finally the target result of segmentation was obtained. According to the characteristics of LUNA16 [6] dataset, this paper made the following three improvements to the traditional ResNet network:
(1) Simplification of network structure (Figure 1). The network first cut the preprocessed CT image randomly into 96 × 96×96 cubes [7] inputting from the starting segment, and enter each stage in turn to extract the corresponding features of the data, and then down sample was conducted along the following stages, and outputted according to stages 1-5 in Figure 1. We added the multi-scale feature module to the last three stages to make the algorithm better adapt the detection targets at different scales. After the continuous fusion of the output results, the corresponding fusion features were sent to the classification module, so as to segment the targets after the positioning of the bounding box. Then we predicted the feature maps extracted in these stages.

Figure 1 Overall block diagram of MS-CSANet
(2) Addition of attention modules (Figure 2). The algorithm in this paper was added an attention module to the 3D ResNet network in the stage of deep supervision, which made the algorithm pay more attention to the features of lung cancer blood vessels in CT images when detecting, and could identify targets more accurately. The feature maps generated by the multi-scale feature module after being fused were input to the attention module from the fourth stage. Stage4 in Figure 2 showed the semantic segmentation Neural Network used in this paper. The simplified UNET + + was selected as the network structure. This model was a U-shaped structure with coding. The central idea was to reuse the features, which could maximize use the extracted data[8]. Firstly, the image features extracted through downsampling entered into the upsampling stage, and this process could superimpose all the previous feature maps with the same resolution. In M1, M2 and M3, the feature maps entered into 1 × 1 convolution after being encoded and decoded differently by the U-shaped topological network structures, and finally two segmentation results appeared. The convolutional block designed in this algorithm could be divided into three stacked 3 × 3 convolution layers. N represented the number of convolutional kernels currently used. The number of convolutional kernels used was 2, 64, 128, and 256 along the arrow direction of downsampling (Figure 1 Stage4). At the same time, due to the need to adopt batch standardized operation, we chose ReLU as the activation function to accelerate training and prevent model overfitting to enhance the nonlinear characteristics in the neural network.

Figure 2 Structure of the revolution blocks in Stage4
(3) The loss function based on Dice coefficient[9] was improved. The optimized ResNet network mentioned earlier in this paper extracted and integrated the features to the greatest extent, and achieved a more accurate distinction between vascular and non vascular. We designed the loss function into two parts: one was the loss Lcls in the classification process, and the other was the loss Lreg in the process of prediction. In order to achieve the purpose of detection task, let the model get more candidate blood vessels that were difficult to identify, and ensure the sufficient sensitivity, the calculation formula of classification loss function adopted in this paper is as follows:
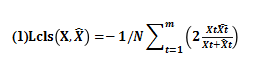
Among them, X and represented the predicted values marked really and pixel level; N represented the size of batch, and T represented the t-th image.
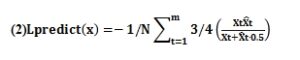
The loss function used in the prediction phase of this paper was as follows. Generally, the loss function of the Dice coefficient had excellent accuracy in training, but when using the dice loss function, the model would have such a situation: Some imperceptible real blood vessels were “abandoned” in order to pursue a high level of dice. We reduced the weight of the predictive values to ensure the high accuracy of the model in segmentation, and provided some candidate vessels for selection to the next classification at an appropriate time.
1.2 Fusion classification model of multi-scale 3D convolution
In the stage of removing the number of false positives in the lung cancer vascular detection system, we used the multi-scale 3D as the input module to train the classification network models under different scales, and the final classification result was based on the fused classification scores. Four scales of different sizes constituted a multi-scale feature module, which consisted of three convolution layers (convolution kernel 1 × 1 × 1, 2 × 2 × 2 and 6 × 6× 6) and an average pooling layer. In addition to the average pooling layer of the fourth layer, the remaining three scales first underwent a small convolution after the input of the image of pulmonary vascular CT (the convolution kernel was 1 × 1× 1) to reduce the dimension of the number of channels to prevent too much calculation caused by too much data in each layer. The first layer used a small convolution of 1 × 1 × 1 to detect tiny and indistinguishable blood vessels, and the second layer used a convolution of 2 × 2 × 2 to detect moderate vessels, and the third layer used a convolution of 6 × 6× 6 to detect thicker arterial vessels. The average pooling layer of the fourth layer could arrange the input features in a matrix, thus reducing the thickness of the feature maps. After the execution of the steps, the different information obtained from each scale was fused to the largest extent, and a new feature map was obtained after processed by the normalization and activation function, as shown in Figure 3.

Figure 3 Multiscale feature module structure
After the multi-scale classification network, our candidate vessels showed two classification results at two scales. The classification results of a candidate vessel Mi used as prediction obtained after the processing of the two network models were recorded respectively as R1 (=k | MI; θ 1) and R2 (= k | MI; θ 2), which were interpreted as the probability that the predicted value of Ti under the two models was equal to K, and K was taken the value as 0 (non vascular) and 1 (vascular). In this paper, the outputs of softmax of the two network models were fused in order to fully integrate the multi-layer context information that different models focused on. The calculation formula of fusion operation is as follows:
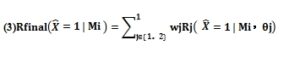
Among them , the left side of the equal sign indicated the probability of the final classification as a real vessel after the fusion. The weight wj corresponding to each classification result was obtained by grid search method (w1 = 0.7, w2 = 0.3).
2.Experimental results and analysis
According to the official evaluation standard of LUNA16, this paper used FROC analysis to evaluate the detection performance of pulmonary vessels of the model. The average number of false positives per scan was considered as the recall rate (sensitivity) in FROC [10]. The higher the sensitivity, the better the model performance, and the lower the false negative in the detection. The calculation formula is as follows:
(4) Sensitivity = tp/ (TP + FN)
Where TP indicated true positive and FN indicated false negative.
In addition, this algorithm introduced the classical model evaluation matrix–confusion matrix [11]. The classification results in machine learning were analyzed and summarized by this matrix, which reflected the classification and model prediction results in the actual data set, as shown in Table 1.
Table 1 The confusion matrix
| Confusion matrix | Forecast results | ||
| Positive | Negative | ||
| Physical results | Positive | True positive | False positive |
| Negative | False negative | True negative | |
Among them, the columns of the matrix represented the actual situation, and the rows of the matrix represented the predicted situation.
Although the FROC curve could directly observe the performance of the model, it lacked comparison with other models. For this reason, this algorithm introduced CPM[12] index to compare the performance difference between this model and other models. The CPM score was an indicator that integrated the recall rate and the number of tolerable false positives. The better the performance of the model, the higher the CPM score [13]. The calculation formula is as follows:
![]()
Where, the value of N was 7; represented the average number of false positives in a single scan and represented the sensitivity corresponding to i=fpr
We drew the FROC curve of the algorithm in this paper, as shown in Figure 4. The CPM value of this method was 0.841, which reflected the effectiveness of the added multi-scale feature block and attention module.

Figure 4 FROC curve of MS-CSANet
Comparative experiments of several groups showed the performance optimization of the improved network presentation proposed in this paper. In order to confirm that the integration algorithm based on deep supervision had obvious effects, firstly, the improved model in this paper was compared by self comparison experiment, and the results were shown in Figure 5. We compared the sensitivity of read M2 only, read M3 only, ResNet without deep supervision, ResNet with deep supervision and the improved algorithm training model in this paper. It was found that the sensitivity of this paper was the highest, which increased to 96.3%.

Figure 5 Comparison of different processing results with same network structure
We selected some recent mainstream algorithms to compare with the algorithm in this paper, as shown in Table 2. It can be seen from the table that the algorithm in this paper performed well on LUNA16 data set. When the false positive rate was 0.25 and 1, the sensitivity of this algorithm was 0.766 and 0.873, respectively, which was the highest among all algorithms. And the CPM score of this algorithm was higher than that of the 3D CNN system proposed by Dou et al. [14], which shows that the improvement of this system has made good achievements.
Table 2 Performance comparison with main stream algorithms on luna16 data set
| Methods | 0.125 | 0.25 | 0.5 | 1 | 2 | 4 | 8 | CPM |
| Dou, et al [14] | 0.659 | 0.745 | 0.819 | 0.865 | 0.906 | 0.933 | 0.946 | 0.839 |
| Krizhevsky, et al[15] | 0.672 | 0.694 | 0.714 | 0.739 | 0.766 | 0.787 | 0.822 | 0.742 |
| Pezeshk, et al[16] | 0.637 | 0.723 | 0.804 | 0.865 | 0.907 | 0.938 | 0.952 | 0.832 |
| Shi, et al[17] | 0.702 | 0.746 | 0.797 | 0.842 | 0.861 | 0.915 | 0.936 | 0.828 |
| MS CSANet | 0.679 | 0.766 | 0.763 | 0.873 | 0.891 | 0.926 | 0.959 | 0.841 |
The actual effects of algorithm detection are shown in Figure 6. Only part of the samples are shown in the figure, in which the detected pulmonary blood vessels have been marked in red, and the blood vessel points are in the box. The left side shows the original CT image in the test set and the middle is the predicted pulmonary vascular mask file, and the far right is the combination effect of the segmented pulmonary vascular mask file and the original CT image. The P value on the right side of the image represents the probability of being predicted as pulmonary vessels. In addition, this paper also presented the results of the average time required for single CT image processing in 10 folds test(showing Table 3).
Table 3 Time required for single CT image processing in 10 folds test
| S/N | 1 | 2 | 3 | 4 | 5 | 6 | 7 | 8 | 9 | 10 | Total average time/s |
| Average time/s | 72.8 | 82.1 | 79.3 | 80.5 | 81.6 | 75.7 | 79.8 | 80.2 | 80.6 | 76.5 | 78.91 |

Figure 6 Display of some test results
3. Conclusion
The 3D CNN pulmonary vascular detection network (MS-CSANet) based on multi-scale attention mechanism proposed in this paper shows a high sensitivity in the LUNA16 data set and high accuracy in the actual detection effects. It reduces the workload of clinicians in smear-reading and the occurrence of false positives to a certain extent.
4. Discussion
Lung cancer is the most common malignant tumor of the lung. The clinical auxiliary diagnosis of lung cancer will first make the of original CT images into images of mediastinal window in lung and then the pulmonary blood vessels are observed. However, the marking of pulmonary blood vessels is manually completed by professional doctors, which has a large workload and is prone to errors in segmentation. When facing huge data, professional doctors only mark the landmark information, which will miss many important information. The coupling of artificial intelligence and clinical medicine undoubtedly provides a new paradigm for solving this problem. In this paper, a 3D CNN pulmonary vascular detection network (MS-CSANet) based on multi-scale attention mechanism was designed, which improved and optimized the three stages of candidate vessel detection, false positive removal and classification in the algorithm framework.
First of all, the part of candidate vessel detection played the advantages of traditional UNet and ResNet, and the idea was consistent with that of Wei Wang and others, who have used LGE-CMR segmentation mode to decompose the original image to obtain image data [18]. Because the core of UNet++ network was reuse, it had higher efficiency than traditional UNet; at the same time, the deep supervision object of ResNet network was improved and then the weighted loss function was introduced, which greatly improved the algorithm performance of the detection part; Haocong et al have confirmed that the pattern analysis method using self supervision was highly similar to human self-consciousness, which meant that the performance of deep supervision had great advantages[19]. Secondly, in the stage of removing false positives, the fusion model of multiscale 3D convolutional neural network has played an important role. The context information of three dimension could provide spatial dimensional information for autonomous learning, and the structure of the network itself was also critical. Tingting et al.’s results have confirmed that deep autonomous learning depended on the space and dimension of the magnetic field when detecting weak electromagnetic intrusion detection[20]. Finally, in the stage of classification, different inputs chose different network structures. The design of 3D convolutional neural network introduced the layer structures of classical convolutional neural networks such as ResNet, because the actual perivascular environment was extremely complex and the thickness of blood vessels was inconsistent. Therefore, using some enhancement methods of special data or designing a suitable network structure with small-scale input may not cause partial data being discarded. Recently, Wei et al. have developed a fusion pattern learning system for gait analysis of patients with depression, which not only designed a long-term memory training model, but also used a short-term training model to enhance the extraction of gait features of patients with depression [21].
It is worth noting that the separation of pulmonary artery and pulmonary vein needs to be evaluated separately in clinic, while this article has not yet differentiated. Because the lesions of small blood vessels being accurately mastered plays a key role in the diagnosis of pulmonary hypertension and other diseases. Physicians can manually mark the pulmonary arteries for grading and then evaluate the vascular cross-sectional area of Grades 4-5, so as to judge whether there is pulmonary artery occlusion and determine whether there is pulmonary hypertension. Moreover, the early manifestations of many cardiovascular diseases are reflected in the lesions of peripheral small blood vessels. It is obviously not enough to only evaluate the cross-sectional area, and the vascular lesions affect the changes of intravascular volume. Therefore, it will have more important clinical significance to distinguish the type and volume of blood vessels, even the fragile density, etc. after three-dimensional structural reconstruction [22] of the original CT image. If these problems can be solved in future research, it will bring more benefits to patients with lung cancer and cardiovascular disease.
Conflict of interest
None
Acknowledgments
None
References
- Liao y, Wu x, Wu m, Fang y, Li J, Tang W. non coding RNAs in lung cancer: emerging regulators of angiogenesis J transl med. 2022 Aug 2; 20 (1): 349. doi: 10.1186/s12967-022-03553-x Pmid: 35918758; Pmcid: pmc9344752
- Setio AA, Ciompi F, Litjens g, gerke P, Jacobs C, van Riel SJ, wille mm, Naqibullah m, Sanchez Ci, van ginneken B. pulmonary nodule detection in CT images: false positive reduction using multi view revolutionary networks IEEE Trans Med imaging 2016 may; 35 (5): 1160-1169. doi: 10.1109/tmi.2016.2536809. ePub 2016 Mar 1. pmid: 26955024
- Zhao J, Zhang C, Li D, Niu J. combining multi-scale feature fusion with multi attribute grading, a CNN model for benign and malignant classification of cystic nodules J digital imaging 2020 Aug; 33 (4): 869-878. doi: 10.1007/s10278-020-00333-1. pmid: 32285220; Pmcid: pmc7522130
- Peng h, sun h, Guo y. 3D multi-scale deep convolutional neural networks for pulmonary nodule detection PLoS one 2021 Jan 7; 16 (1): e0244406.doi: 10.1371/journal.pone.0244406. pmid: 33411741; Pmcid: pmc7790422
- Lyu x Q, Wu L, Gu y, et al.detection of low dose CT pulmonary nodules based on 3D revolution neural network [J] Optics and precision engineering, 2018, 26 (5): 1211- 1218
- Naseer I, Akram s, Masood T, Jaffar a, Khan MA, Mosavi A. performance analysis of state of the art CNN architectures for luna16. sensors (Basel) 2022 Jun 11; 22 (12): 4426. doi: 10.3390/s2224426. pmid: 35746208; Pmcid: pmc9227226
- Blandin Knight s, Crosbie PA, balata h, chudziak J, hussell T, dive C. progress and prospects of early detection in lung cancer Open biol. 2017 Sep; 7 (9): 170070. doi: 0.1098/rsob.170070. pmid: 28878044; Pmcid: pmc5627048
- Fern á ndez JG, mehrkanoon S. broad UNET: multi scale feature learning for nowcasting tasks Neural netw 2021 Dec; 144:419-427. doi: 10.1016/j.neunet.2021.08.036. ePub 2021 Sep 10. pmid: 34563751
- Liu Z, Zhang J, jog V, LOH PL, McMillan ab. robust deep networks for medical image segmentation J digital imaging 2021 Oct; 34 (5): 1279-1293. doi: 10.1007/s10278-021-00507-5. ePub 2021 Sep 20. pmid: 34545476; Pmcid: pmc8554958
- Bandos AI, obuchowski na Evaluation of diagnostic accuracy in free response detection localization tasks using ROC tools Stat methods Med res. 2019 Jun; 28 (6): 1808-1825. doi: 10.1177/0962280218776683. ePub 2018 Jun 19. pmid: 29921163
- Chicco D, t ö Tsch n, jurman g. the Matthews correlation coefficient (MCC) is more reliable than balanced accuracy, bookmaker information, and marketing in two class conflict matrix evaluation Biodata min. 2021 Feb 4; 14 (1): 13. doi: 10.1186/s13040-021-00244-z Pmid: 33541410; Pmcid: pmc7863449
- Hara K, Kataoka h, Satoh y. can spatiotemporal 3D CNNs retrieve the history of 2D CNNs and Imagenet// 2018 proceedings of the IEEE Conference on computer vision and pattern recognition Lake tahoe: IEEE, 2018: 18-22
- Zheng s, cornelissen LJ, Cui x, Jing x, veldhuis RNJ, Oudkerk m, van OOIJEN pma Deep convolutional neural networks for multiplanar lung nodule detection: improvement in small nodule identification Med phys 2021 Feb; 48 (2): 733-744. doi: 10.1002/mp.14648. ePub 2020 Dec 30. pmid: 33300162; Pmcid: pmc7986069
- Dou Q, Chen h, Yu L, Qin J, Heng Pa. multilevel contextual 3-D CNNs for false positive reduction in pulmonary nodule detection IEEE Trans Biomed Eng. 2017 Jul; 64 (7): 1558-1567. doi: 10.1109/tbme.2016.2613502. ePub 2016 Sep 26. pmid: 28113302
- Krizhevsky a, sutskever I, Hinton g E. Imagenet classification with deep convolutional neural networks/ / 2012 proceedings of the 25th International Conference on neural information processing systems Lake tahoe: IEEE, 2012: 1097-1105
- Pezeshk a, hamidian s, Petrick n, sahiner B. 3-D revolutionary neural networks for automatic detection of pulmonary nodules in chest ct. IEEE J Biomed health information 2019 Sep; 23 (5): 2080-2090. doi: 10.1109/jbhi.2018.2879449. ePub 2018 Nov 9. pmid: 30418929
- Shi y, Li h, Zhang h, et al. accurate and effective LIF nets for 3D detection and recognition IEEE access, 2020, 8: 98562-98571
- Wei Shao, Zhiyang you, Lesheng Liang, Xiping Hu, Chengming Li, Wei wang*, bin hu “A multi modal gait analysis based depression detection system.” IEEE Journal of biomedical and health informatics (jbhi), 2021, doi: 10.1109/jbhi.2021.3122299
- Wei Wang, Xinhua Yu, Bo Fang, Dianna Yue Zhao, Yongyong Chen, Wei Wei, and Junxin chen “Cross modality lge-cmr segmentation using image to image translation based data augmentation.” ieee/acm transactions on computational biology and bioinformatics (2022)
- Haotong Rao, Siqi Wang, Xiping hu*, Mingkui Tan, Yi Guo, Jun Cheng, Xinwang Liu, bin hu “A self supervised gait encoding approach with locality awareness for 3D skeleton based person re identification.” IEEE Transactions on pattern analysis and machine intelligence (tpami), 2021, doi: 10.1109/tpami.2021.3092833
- Ting Wang, Jianqing Li, Wei Wei, Wei Wang, and Kai Fang, “deep learning based weak electronic introduction detection method for the zero touch industrial Internet of things”, IEEE network (2022)
- Deng F, Mu C, Yang L, Yi R, Gu m, Li K. The differentiation in image post-processing and 3D reconstruction during evaluation of carotid plaques from Mr and CT data sources Front physiol 2021 APR 16; 12: 645438. doi: 10.3389/fphys.2021.645438. pmid: 33935800; Pmcid: pmc8085352
Copyright
© This work is licensed under a Creative Commons Attribution 4.0 International License. The images or other third party material in this article are included in the article’s Creative Commons license, unless indicated otherwise in the credit line; if the material is not included under the Creative Commons license, users will need to obtain permission from the license holder to reproduce the material. To view a copy of this license, visit http://creativecommons.org/licenses/by/4.0/
