J Med Discov (2019); 4(2):jmd19017; DOI:10.24262/jmd.4.2.19017;
Received May 25th, 2019, Revised June 17th, 2019, Accepted June 20th, 2019, Published June 20th, 2019
The inhibiting effect of oncolytic adenovirus on the proliferation of cervical carcinoma cells in vivo and vitro
Ming Zhang1*, Jing Zhao1, Jing Li2, Hualin Wei1, Pintian Lv1, Xinbo Duan1, Jia Liu1
1Department of Radiation Oncology, Hebei General Hospital, Shijiazhuang, Hebei 050011, China.
2Department of Traditional Chinese Medicine,The Fourth Affiliated Hospital, Hebei Medical University, Shijiazhuang, Hebei 050011, China
* Correspondence: Ming Zhang, Department of Radiation Oncology, Hebei General Hospital, Shijiazhuang, 050051, China.E-mails: Zhangming096@163.com.
Abstract
Background: To explore the inhibitory effect of the oncolytic adenovirus that is driven by the midkine gene promoter (Ad-MK) alone or in combination with paclitaxel on the proliferation of cervical carcinoma cells in vivo and vitro.
Methods: MTT was performed to measure Hela cell viability . The scratch test and transwell test were employed to detect the invasion and migration of Hela cells after treated with Ad-MK. Flow cytometry analysis was used to monitor the apoptosis of the cell under different conditions in vivo and vitro. The expressions of apoptosis factor and angiogenesis genes were analyzed by Q-PCR and western blot in Hela cells and tumor tissues.
Results: The results showed that the proliferation, invasion and migration of cells were significantly suppressed after treated with Ad-MK. There was a synergistic effect of Ad-MK in combination with paclitaxel. The mRNA and protein expressions of PCNA and Bcl2 were down-regulated in the cells after treated with Ad-MK alone or in combination with paclitaxel, and while the expressions of Bax and Caspase3 were up-regulated at both mRNA and protein levels. The expressions of cleaved Caspase3 were also increased. The tumor volume, the tumor relative volume and the tumor weight were markedly decreased in Ad-MK treated groups. The number of cells in late apoptotic stage were increased after incubated with Ad-MK. The mRNA and protein expressions of PCNA, cyclinD, Bcl2, VEGF, MMP2 and MMP9 in the Ad-MK and Ad-MK in combination with paclitaxel group was decreased, and contrarily the expressions of P16, Bax and Caspase3 were increased after the tumor treated with Ad-MK and Ad-MK in combination with paclitaxel.
Conclusion: Ad-MK alone or in combination with paclitaxel can selectively replicate and inhibit the proliferation of Hela cells and the growth of tumor cells. There may be a synergistic effect of Ad-MK in combination with paclitaxel.
Keywords: conditionally replicating oncolytic adenovirus, midkine, Hela cell, synergism
Introduction
Cancer is one of the most difficult curative and prevalent disease all over the world. It has characteristics of high incidence, easy to relapse and hard to cure[1]. In 2018, 1,735,350 new cancer cases and 609,640 cancer deaths are estimated to occur in the United States [2]. Nowadays, cancer has become the leading threat to human health. The method of surgical excision of the lesion locations is the most common treatment for cancer [3]. However, this method may result in serious side effects of infections, bleeding, and injury to adjacent tissues. At the same time, surgery may not remove the metastatic lesions completely, and some advanced cancer patients are not suitable for surgical resection. Chemotherapy and radiotherapy are commonly the adjuvant therapy of surgery [4]. However, chemotherapy and radiotherapy are difficult to cure cancer, and fatality rate of cancer is still the high. Therefore, there is an urgent need to find a new treatment to increase the survival rate of cancer patients.
In recent years, with the development of the research on the molecular mechanisms of viruses and tumors, gene therapy has received increasing attention in cancer treatment [5, 6]. Among them, adenoviruses (Ads) vectors have become one of the most widely used vectors in gene therapy, because of their high gene transfer efficiency, high titer in technology, and inability to integrate with host cells in the body [7-9]. To research the effect of adenovirus on tumor cells, more and more studies were carried out. Jiang et al. [10] revealed that oncolytic adenovirus and tumor-targeting immune modulatory therapy improved the autologous cancer vaccination. Bressy et al. [11] reported that oncolytic adenoviruses and valproic acid could be used in combination for the treatment of colon carcinomas.
Conditionally replicating oncolytic adenovirus is a tumor-specific proliferation virus [12, 13]. It has no replication or killing effect in normal cells. Instead, it selectively replicates and lyses tumor cells. After tumor cell lysis, the progeny virus particles releases and infects neighboring tumor cells. The repeated proliferation of virus is important to kill cancer cells. The selection of promoters is critical to virus replication, which is one of the current research hotpots to find the active promoter in most tumor cells. Studies have shown that midkine (MK) is closely related to the occurrence and development of tumors, and it is highly expressed in a variety of malignant tumors such as esophageal cancer, gastric cancer, colorectal cancer, lung cancer, breast cancer, and pancreatic cancer [14]. Takagi-Kimura et al. [15] developed a midkine promoter-regulated oncolytic vector that was based on human adenovirus serotype 5. This vector has the characteristic of tumor-specific. They further confirmed that the mRNA expression of Midkine and its promoter activity were significantly higher in five human osteosarcoma cell lines, but were restricted in normal cells.
At present, there is no reports on the inhibitory effect of Ad-MK alone or combination with natural anticancer drugs paclitaxel on cervical carcinoma cells. This research aims to study the effect of Ad-MK combined with or without paclitaxel on cervical carcinoma cells.
Materials and methods
Cells and viruses
Hela cancer cells (cervical carcinoma) are derived from routine preservation in our laboratory. Hela cells were cultured in DMEM (high glucose, Hyclone) medium supplemented with 10% fetal calf serum (Sigma, USA), 100 U mL-1 penicillin (Sigma, USA), and 100 mg mL-1 streptomycin (Sigma, USA) at 37 ℃ with 5% CO2 under a 95% humidified atmosphere. Conditionally replicating oncolytic adenovirus that driven by the MK gene promoter (Ad-MK) were given by Professor Tagawa of Chiba Cancer Center Research Institute, Japan.
Cell viability analysis
The methyl thiazolyl tetrazolium (MTT) assay was used to measure the cell viability in vitro. Hela cells in log phase were trypsinized and then seeded in 96-well plates with 2× 10⁴ per well. After 24 h resting time, the cells were treated with different conditions: A) Control; B) add MOI 0.1 conditionally replicating oncolytic adenovirus (Ad); C) add MOI 0.1 conditionally replicating oncolytic adenovirus that driven by the MK gene promoter (Ad-MK); D) add MOI 0.1 Ad-MK and 6ug/ml paclitaxel (Ad-MK-Pac). After 48 h,20 uL of MTT solution was added to each well. After incubated for 4 h. 150 uL of DMSO was added to solubilize the formazan crystals. Optical density (OD) measured the absorbance of the suspensions at a wavelength of 490 nm. Then the cell viability was expressed as follows: cell viability (%) = [A]test / [A]control × 100%, where [A] represents the absorbance value at 490 nm.
Scratch test
After trypsinization, Hela cells were resuspended and seeded onto a six-well plate. After 24 h, a horizontal ‘scratch’ was made using a pipette tip in the cell monolayer.
DMEM medium was added for culturing for 24h, and then replaced with fresh medium for a further 24h.Cell migration into the scratched area was observed and imaged.
Cell invasion assay
DMEM without serum containing 5 × 10⁴ Hela cells was placed into the upper compartment of a Transwell insert, while DMEM containing 10% FBS was added in the lower compartment as a chemoattractant. The filter of the Transwell insert was coated with Matrigel to act as extracellular matrix. This Transwell system was incubated for 16 h in 5 % CO2 at 37 ℃. Cells on the lower surface were stained using 0.1 % crystal violet. The cells that permeated the filter were counted.
Xenograft tumor mouse model
Three-week-old BALB/c female athymic nude mice were purchased from Beijing Weitong Lihua Experimental Animal Co., Ltd.. All relevant experiments involving mice were approved by the Animal Ethics Committee of Hebei General Hospital (HBGH-2015-023). Hela cells (0.10 mL volume containing 1 × 10⁶ cells per mL of media) were inoculated subcutaneously in the right side of back to generate subcutaneous tumor models. When tumor grew to approximately 0.7 – 0.8 cm in length, mice are randomly divided into four groups and each group included 5 mice. Each group mice preceived a subcutaneous injection of different materials near the tumor location and in the right side of their back: A) Control; B) 1 × 10⁹ pfu/ml Ad (Ad); C) add 1 × 10⁹ pfu/ml Ad-MK (Ad-MK-L); D) add 1 × 10⁹ pfu/ml Ad-MK and 6ug/ml paclitaxel (Ad-MK-Pac). When the tumor volume reached 4000 mm3, mice were sacrificed and measured the related index of tumor.
The measurement of tumor
Tumor volume (TV)
TV = 1 / 2 ´ a ´ b2, where a represents the long diameter of the tumor, b represents the short diameter of the tumor.
Tumor growth inhibitory rate (GI)
GI = [1 – (TVt – TV0) / (CVt – CT0)] × 100%, where TVt represents the tumor volume at each time point in the treatment group, TV0 represents the tumor volume at the initial time in the treatment group, CVt represents the tumor volume at each time point in the control group, CT0 represents the tumor volume at the initial time in the control group.
Relative tumor volume (RTV)
RTV = Vt / Vo, where V0 represents the tumor volume at the initial time, Vt represents the tumor volume at each time point.
Relative tumor proliferation rate (T/C)
T/C (%) = (TRTV/CRTV) × 100%, where TRTV represents the RTV of the treatment group, CRTV represents the RTV of the control group.
The evaluation is invalid when this value is greater than 40%, and valid when this value is less than 40% (P<0.05).
Tumor weight inhibition rate (IR)
IR = (WC – WT) / WC × 100%, where WC represents the tumor weight of the control group, WT represents the tumor weight of the treatment group.
Flow cytometry analysis
To monitor the apoptosis of the cell under different conditions in vivo and vitro, Hela cells were stained with PI and AnexinV in PBS solution for 15 minutes at room temperature. The cells were finally resuspended in 0.5 ml PBS after being washed once with PBS. The stained cells were then analyzed using flow cytometry.
The expressions of apoptosis factor and angiogenesis genes
The expressions of PCNA, P16, cyclinD, Bcl2, Bax, Caspase3, VEGF, MMP2, MMP9 were analyzed by Q-PCR and western blot in Hela cells and tumor tissues.
Statistical analysis
Data were expressed as mean ± standard deviation (SD). Statistical analysis was performed using SPSS 17.0. Statistical comparisons between groups were performed using ANOVA and a non-parametric test. Differences were considered statistically significant at P<0.05.
Results
The Ad-MK treatment decreased viability, migration, and invasion of Hela cells
The proliferation characteristics of the Hela cells with different treatments were analyzed using the MTT assay. The cell viability of Hela cells were significantly declined after treated with Ad-MK, Ad-MK-Pac, respectively (Table 1).
Table 1 The effects of Ad-MK alone or in combination with paclitaxel on the cell viability of Hela cells.
| Group | D490 nm | Cell viability(%) |
| Control | 1.106 ± 0.071 | 100 |
| Ad | 1.071 ± 0.115 | 96.79 ± 7.33 |
| Ad-MK | 0.731 ± 0.062*** ### | 66.19 ± 4.47*** ### |
| Ad-MK-Pac | 0.458 ± 0.082*** ### &&& | 41.65 ± 8.70*** ### &&& |
* P < 0.05, ** P < 0.01, *** P < 0.001, vs the Control.
# P < 0.05, ## P < 0.01, ### P < 0.001, vs the Ad.
& P < 0.05, && P < 0.01, &&& P < 0.001, vs the Ad-MK.
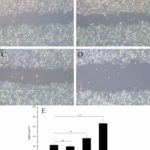
The migration ability of the cells was tested by the scratch test. Following the scratch procedure, cells grew rapidly into the scratch area in the control group and Ad group. However, in the Ad-MK, Ad-MK-Pac group, there were dramatically less migration into the scratch indicating that the migration ability of Hela cells treated with Ad-MK, Ad-MK-Pac were weaker than control cells (Fig. 1).
Figure 1. Scratch test. Cells were monitored over a 24 h period to determine their relative capability to move into this area. A) Control group, B) Ad group (empty vector), C) Ad-MK group, D) Ad-MK-Pac group. E) Quantification analysis of every group. * P ≤ 0.05; ** P ≤ 0.01; *** P ≤ 0.001. ns, non-significant. Images show cell migration into the denuded area at 24h.
In the Transwell invasion test, the invasion ability of Hela cells was severely reduced in the group treated with Ad-MK, Ad-MK-Pac (Fig. 2).
Figure 2. Cell invasion assay. Using Transwell inserts, cells were induced by FBS to migrate to the lower surface of the Transwell membrane. Transmigrated cells were stained with crystal violet (the colored areas). A) Control group, B) Ad group (empty vector), C) Ad-MK group, D) Ad-MK-Pac group, E) Quantification analysis of every group. * P ≤ 0.05; ** P ≤ 0.01; *** P ≤ 0.001. ns, non-significant.
The expressions of apoptosis factor mRNA and protein in the Hela cells
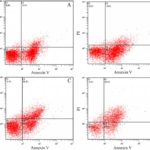
We next investigated whether ad-MK treatment induced apoptosis in Hela cells. Compared with the control and the interference group (Ad group), the flow cytometry analysis showed that Ad-MK and Ad-MK in combination with paclitaxel showed reasonable cytotoxicity and led more than 25% of cells to late apoptotic stage (26.4 % for Ad-MK, 47.3 % for Ad-MK-Pac, Fig. 3, Table 2). Using Q-PCR, we quantified the expression of PCNA, Bcl2, Bax and Caspase3 mRNA in cells treated with different materials. Compared with the control group and the Ad group, the expressions of PCNA and Bcl2 mRNA in the Ad-MK and Ad-MK-Pac were remarkably decreased, while, the expressions of Bax and Caspase3 mRNA in the Ad-MK and Ad-MK-Pac were prominently increased (Table 3).
Figure 3. The flow cytometry analysis on Hela cells (apoptosis and necrosis assay) cultured in different materials. A) Control group, B) Ad, C) Ad-MK and D) Ad-MK-Pac group. C1 represents the necrotic cells appeared at the upper left corner. C2 represents the dead cells appeared at the upper right corner. C3 represents the live cells appeared at the lower left corner. C4 represents the early apoptotic cells appeared at the lower right corner.
Table 2 The flow cytometry analysis on Hela cells (apoptosis and necrosis assay) cultured in different materials
| Group | C1 | C2 | C3 | C4 |
| Control | 0.80% | 9.10% | 46.90% | 43.30% |
| Ad | 0.50% | 9.60% | 35.50% | 54.40% |
| Ad-MK | 2.30% | 26.40% | 42.50% | 28.90% |
| Ad-MK-Pac | 4.90% | 47.30% | 26.20% | 21.60% |
C1 represents the necrotic cells appeared at the upper left corner. C2 represents the dead cells appeared at the upper right corner. C3 represents the live cells appeared at the lower left corner. C4 represents the early apoptotic cells appeared at the lower right corner.
Table 3 The expression level of Caspase3, PCNA, Bax, Bcl2 mRNA in Control group, Ad group, Ad-MK group, Ad-MK-Pac group.
| Group | PCNA | Bcl2 | Bax | Caspase3 |
| Control | 1.046 ± 0.135 | 0.956 ± 0.087 | 1.058 ± 0.157 | 1.136 ± 0.632 |
| Ad | 0.991 ± 0.154 | 0.963 ± 0.065 | 1.012 ± 0.133 | 1.161 ± 0.087 |
| Ad-MK | 0.609 ± 0.166* # | 0.502 ± 0.084** ## | 1.901 ± 0.214** ## | 2.682 ± 0.546** ## |
| Ad-MK-Pac | 0.306 ± 0.014** # | 0.398 ± 0.063*** ### | 3.627 ± 0.538*** ## && | 4.226 ± 0.562** ## & |
* P < 0.05, ** P < 0.01, *** P < 0.001, vs the Control. # P < 0.05, ## P < 0.01, ### P < 0.001, vs the Ad. & P < 0.05, && P < 0.01, &&& P < 0.001, vs the Ad-MK.
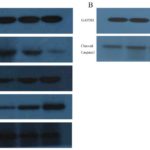
We also quantified the expressions of PCNA, Bcl2, Bax and Caspase3 protein in the cells of different groups. Compared with the control group and the Ad group, the expressions of PCNA and Bcl2 protein in the Ad-MK, Ad-MK-Pac groups were decreased, while the expressions of Bax and Caspase3 protein in the Ad-MK, Ad-MK-Pac groups were increased (Fig. 4A). After exposure to Ad-MK and Ad-MK-Pac, expression of cleaved Caspase3 were increased in Hela cells (Fig. 4B).
Figure 4. A) Western blot analysis of Caspase3, PCNA, Bax, Bcl2 protein, and
B) cleaved Caspase3. From left to right is Control group, Ad group, Ad-MK group and Ad-MK-Pac group. GAPDH was used as an internal control.
The growth of tumor in vivo
Compared with the control group, the tumor volume, relative tumor volume and the tumor weight of Ad-MK treated groups were markedly decreased. After two weeks, the tumor growth inhibitory rate, relative tumor proliferation rate and tumor weight inhibition rate treated with Ad-MK and Ad-MK-Pac reached to 68.27% and 106.51%, 39.74% and 8.67%, 50.82% and 86.91%, respectively. (Table 4).
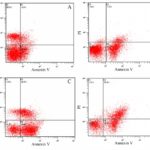
Furthermore, compared with the control and the Ad group, the flow cytometry analysis showed that Ad-MK and Ad-MK-Pac had reasonable cytotoxicity and led 22.5% and 35.8% of cells to late apoptotic stage (Fig. 5, Table 5).
Figure 5. The flow cytometry analysis on tumor cells (apoptosis and necrosis assay) cultured in different materials.
A) Control group,
B) Ad group,
C) Ad-MK group, and
D) Ad-MK-Pac group. C1/E1 represents the necrotic cells appeared at the upper left corner.
C2/E2 represents the dead cells appeared at the upper right corner.
C3/E3 represents the live cells appeared at the lower left corner.
C4/E4 represents the early apoptotic cells appeared at the lower right corner.
Table 4 The mean of tumor volume and relative tumor volume, tumor weight of different group.
| Group |
The mean of tumor volume(mm3)± S.E.M, Tumor growth inhibitory rate (GI, %) |
The mean of relative tumor volume (RTV, mm3) ± S.E.M, Relative tumor proliferation rate (T/C, %) |
Tumor weight (g) ± S.E.M | Tumor weight inhibition rate(%) | ||||
| Before treatment | One weeks | Two weeks | Before treatment | One weeks | Two weeks | |||
| Control | 229.43 ± 14.89 | 1105.75 ± 34.61 | 1675.26 ± 79.49 | 100.00 ± 0.00 | 345.29 ± 19.59 | 755.01 ± 52.90 | 1.83 ± 0.09 | — |
| Ad | 232.41 ± 15.08 | 1071.29 ± 36.99 | 1605.96 ± 82.51 | 100.00 ± 0.00 | 344.21 ± 19.42 | 750.09 ± 52.93 | 1.76 ± 0.09 | — |
| Ad-MK | 229.17 ± 14.23 | 427.82 ± 28.79** ### | 674.29 ± 58.11** ### | 100.00 ± 0.00 | 195.06 ± 16.39** ### | 298.48 ± 26.65** ### | 0.89 ± 0.06** ### | 50.82 |
| GI | 63.48 | 68.27 | T/C | 56.67 | 39.74 | |||
| Ad-MK-Pac | 228.67 ± 14.53 | 163.91 ± 16.63** ### &&& | 148.50 ± 26.02** ### &&& | 100.00 ± 0.00 | 71.90 ± 5.49** ### &&& | 65.09 ± 12.99** ### &&& | 0.22 ± 0.04** ### &&& | 86.91 |
| GI | 111.98 | 106.51 | T/C | 20.88 | 8.67 | |||
* P < 0.05, ** P < 0.01, *** P < 0.001, vs the Control. # P < 0.05, ## P < 0.01, ### P < 0.001, vs the Ad.

& P < 0.05, && P < 0.01, &&& P < 0.001, vs the Ad-MK.
The expressions of apoptosis factor and angiogenesis genes mRNA and protein in the tumor
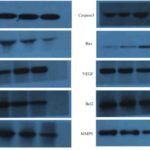
- PCR and western blot test showed that the expressions of PCNA, cyclinD, Bcl2, VEGF, MMP2 and MMP9 mRNA and protein in the Ad-MK and Ad-MK-Pac group were decreased, while the expression of P16, Bax, Caspase3 mRNA and protein were increased (Table 6, Fig. 6).
Table 5 The flow cytometry analysis on tumor cells (apoptosis and necrosis assay) cultured in different materials. C1/E1 represents the necrotic cells appeared at the upper left corner. C2/E2 represents the dead cells appeared at the upper right corner. C3/E3 represents the live cells appeared at the lower left corner. C4/E4 represents the early apoptotic cells appeared at the lower right corner
| Group | C1/E1 | C2/E2 | C3/E3 | C4/E4 |
| Control | 19.50% | 6.90% | 55.80% | 17.90% |
| Ad | 1.60% | 7.50% | 57.70% | 33.20% |
| Ad-MK | 7.90% | 22.50% | 21.50% | 48.00% |
| Ad-MK-Pac | 1.50% | 35.80% | 30.50% | 32.10% |
Table 6 The expression level of Caspase3, PCNA, Bax, P16, VEGF, cyclinD, Bcl2, MMP2, MMP9 mRNA in Control group, Ad group, Ad-MK group and Ad-MK-Pac group.
| PCNA | P16 | cyclinD | Bcl2 | Bax | Caspase3 | VEGF | MMP2 | MMP9 | |
| Control |
1.092 ± 0.130 |
1.01 ± 0.102 |
0.974 ± 0.066 |
0.859 ± 0.211 |
1.011 ± 0.089 |
0.912 ± 0.111 |
1.088 ± 0.080 |
1.013 ± 0.111 |
1.011 ± 0.182 |
| Ad |
1.127 ± 0.117 |
0.999 ± 0.115 |
1.059 ± 0.115 |
0.862 ± 0.110 |
1.071 ± 0.080 |
1.136 ± 0.280 |
1.059 ± 0.117 |
1.002 ± 0.109 |
1.009 ± 0.107 |
| Ad-MK |
0.64 ± 0.116**## |
1.816 ± 0.166**## |
0.512 ± 0.100**## |
0.441 ± 0.064*## |
1.618 ± 0.229*# |
2.175 ± 0.308**## |
0.678 ± 0.087**## |
0.521 ± 0.102**## |
0.516 ± 0.059**## |
| Ad-MK-Pac |
0.327 ± 0.085***###& |
3.258 ± 0.357***###&& |
0.364 ± 0.060***### |
0.248 ± 0.073**###& |
3.344 ± 0.360**##&& |
4.097 ± 0.692***##& |
0.496 ± 0.094***## |
0.311 ± 0.018***###& |
0.287 ± 0.032**###&& |
* P < 0.05, ** P < 0.01, *** P < 0.001, vs the Control. # P < 0.05, ## P < 0.01, ### P < 0.001, vs the Ad. & P < 0.05, && P < 0.01, &&& P < 0.001, vs the Ad-MK.
Figure 6. The expression levels of Caspase3, PCNA, Bax, P16, VEGF, cyclinD, Bcl2, MMP2 and MMP9 protein in each group. From left to right is Control group, Ad group, Ad-MK group and Ad-MK-Pac group. GAPDH was used as an internal control.
Discussion
Cervical cancer is one of the most common female reproductive system malignancies in the world. Many studies have proved that its occurrence, development, and metastasis is a complex process in which complex factors, and multiple genes are involved. Conditionally replicating oncolytic adenovirus is a tumor-specific proliferation virus. Midkine (intermediate factor) plays a specific role in the occurrence and development of cervical cancer. Targeted treatment of Midkine has become one of the research focus.
Takagi-Kimura et al. [15] developed a midkine promoter-regulated oncolytic vector that was based on human adenovirus serotype 5 and found that the expression of Midkine mRNA and its promoter activity was significantly higher in five human osteosarcoma cell lines, but was restricted in normal cells. This study found that Ad-MK could suppress the capabilities of proliferation, invasion and migration of Hela cells. Ad-MK also could induce the decrease of the tumor volume, the tumor relative volume and the tumor weight.
The proliferation of cells was regulated by many factors. Proliferating cell nuclear antigen (PCNA) is a DNA clamp that acts as a processivity factor and is essential for replication [16]. B-cell lymphoma-2 (Bcl2) is an oncogene that inhibits the apoptosis of cells [17]. Overexpression of Bax can antagonize the protective effect of Bcl2 and accelerate the programmed cell death [18]. Caspase3 is the most important terminal cleavage enzyme in apoptosis [19]. Caspase3 is activated and cleaved after apoptotic signaling events occur [20]. The P16 gene directly participates in the regulation of the cell cycle and negatively regulates cell proliferation and division [21]. Vascular endothelial growth factor (VEGF) stimulates the formation of blood vessels [22]. In the current research, after treated with Ad-MK, the expression of PCNA and Bcl2 mRNA and protein in the cell and tumor were decreased, while the expression of Bax and Caspase3 mRNA and protein and cleaved Caspase 3 proteins were increased, indicating that Ad-MK may inhibit the proliferation and promote apoptosis of Hela cells and inhibit the growth of tumor cells by affecting the expressions of apoptosis and angiogenesis genes.
Ingemarsdotter et al. [23] found that the paclitaxel markedly increased the effect of multiple Ad5 vectors on ovarian cancer in vitro and in vivo. This was related to the greater infectivity because of the up-regulated expression of coxsackie adenovirus receptor. In our research, the Ad-MK and paclitaxel have synergistic effects on Hela cells.
This study explored the effect of Ad-MK alone or in combination with paclitaxel on the proliferation of Hela cells and the growth of tumor. The results showed that Ad-MK inhibited the cells proliferation, invasion and migration and the tumor of growth. There was a synergistic effect of Ad-MK in combination with paclitaxelwhich might be a potential therapeutic strategy for the cervical carcinoma and other cancers.
Conflict of interest
There are no competing interests to declare.
Acknowledgments
This work was supported by Medical ScientificResearch Project of Hebei Health and Family Planning Commission (Grants No. ZL20140230).
References
1. Dizon DS, Krilov L, Cohen E et al. Clinical cancer advances 2016: annual report on progress against cancer from the American Society of Clinical Oncology. Journal of clinical oncology: official journal of the American Society of Clinical Oncology.2016;34(9): 987.
2. Siegel RL, Miller KD, Jemal A. Cancer statistics, 2018. CA Cancer J Clin. 2018; 68(1):7-30.
3. Van Loo E, Mosterd K, Krekels GA et al. Surgical excision versus Mohs’ micrographic surgery for basal cell carcinoma of the face: a randomised clinical trial with 10 year follow-up. Eur J Cancer. 2014; 50(17):3011-20.
4. Miller KD, Siegel RL, Lin CC3. et al. Cancer treatment and survivorship statistics, 2016.CA Cancer J Clin. 2016;(4):271-89.
5. Husain SR, Han J, Au P et al. Gene therapy for cancer: regulatory considerations for approval. Cancer Gene Ther. 2015; 22(12): 554-63.
6. Naldini L. Gene therapy returns to centre stage. Nature. 2015; 526(7573):351-60.
7. Fukuhara H, Ino Y, Todo T. Oncolytic virus therapy: a new era of cancer treatment at dawn. Cancer science.2016;107(10): 1373-79.
8.Shaw AR, Suzuki M. Recent advances in oncolytic adenovirus therapies for cancer. Current opinion in virology. 2016;21:9-15.
9.Havunen R, Siurala M, Sorsa S et al. Oncolytic adenoviruses armed with tumor necrosis factor alpha and interleukin-2 enable successful adoptive cell therapy. Molecular Therapy-Oncolytics. 2017;4:77-86.
10. Jiang H, Rivera-Molina Y, Gomez-Manzano C et al. Oncolytic adenovirus and tumor-targeting immune modulatory therapy improve autologous cancer vaccination. Cancer research. 2017;77(14): 3894-907.
11. Bressy C, Majhen D, Raddi N et al. Combined therapy of colon carcinomas with an oncolytic adenovirus and valproic acid. Oncotarget.2017;8(57): 97344-60.
12. Li S, Ou M, Wa et al. Application of conditionally replicating adenoviruses in tumor early diagnosis technology, gene-radiation therapy and chemotherapy. Applied microbiology and biotechnology. 2016; 100(19): 8325-35.
13. Dobbins GC, Ugai H, Curiel DT, et al. A multi targeting conditionally replicating adenovirus displays enhanced oncolysis while maintaining expression of immunotherapeutic agents. PloS one. 2015;10(12): e0145272.
14. Rawnaq T, Dietrich L, Wolters-Eisfeld G, et al. The multifunctional growth factor midkine promotes proliferation and migration in pancreatic cancer. Molecular Cancer Research.2014; 12(5): 670-80.
15. Takagi-Kimura M, Yamano T, Tagawa M, et al. Oncolytic virotherapy for osteosarcoma using midkine promoter-regulated adenoviruses. Cancer gene therapy.2014;21(3): 126-32.
16. Müller R, Misund K, Holien T, et al. Targeting proliferating cell nuclear antigen and its protein interactions induces apoptosis in multiple myeloma cells. PloS one.2013, 8(7): e70430.
17. Um D. Bcl-2 family proteins as regulators of cancer cell invasion and metastasis: a review focusing on mitochondrial respiration and reactive oxygen species. Oncotarget. 2016;7(5): 5193-203.
18. Zhang L, Yu J, Park B H, et al. Role of BAX in the apoptotic response to anticancer agents. Science.2000;290(5493): 989-92.
19. Boland K, Flanagan L, Prehn M. Paracrine control of tissue regeneration and cell proliferation by Caspase-3. Cell death & disease.2013; 4(7): e725.
20. Walters J, Pop C, Scott L, et al. A constitutively active and uninhibitable caspase-3 zymogen efficiently induces apoptosis. Biochemical Journal.2009;424(3): 335-45.
21. Rayess H, Wang B, Srivatsan S. Cellular senescence and tumor suppressor gene p16. International journal of cancer. 2012;130(8): 1715-25.
22. Goel L, Mercurio M. VEGF targets the tumour cell. Nat Rev Cancer. 2013;13(12):871-82.
23. Ingemarsdotter CK, Tookman LA, Browne A, et al. Paclitaxel resistance increases oncolytic adenovirus efficacy via upregulated CAR expression and dysfunctional cell cycle control. Mol Oncol. 2015; 9(4):791-805.
Copyright
© This work is licensed under a Creative Commons Attribution 4.0 International License. The images or other third party material in this article are included in the article’s Creative Commons license, unless indicated otherwise in the credit line; if the material is not included under the Creative Commons license, users will need to obtain permission from the license holder to reproduce the material. To view a copy of this license, visit http://creativecommons.org/licenses/by/4.0/


